
Fantasy football is a growing pastime. Year in and year out more and more fans start playing the game within the game. As a result, year after year the competition gets tougher and tougher. In order to best your opponents, you need to be able to sift through the seemingly endless amounts of information out there. Team previews, opinion pieces, and stats on stats on stats. It can be difficult for newcomers and even the most experienced players to figure out what is signal and what is noise.
This article tries to help you cut through that wall of information by isolating the statistics that most strongly correlate to points per reception (PPR) fantasy points. Stats do not have bias or opinions, but they should be critical in the formation of them. Before you agree or disagree with a “hot take” or go to pick up that player off the waiver wire, make sure to use these statistics to help you drive your decisions.
In our process, we will be measuring the strength of the relationship between two different statistics. In our case, one of the statistics (or variables) will always be PPR fantasy points. We will then try to correlate the PPR points with one of the other statistics you may see attributed to one of your fantasy players. We will be pulling our data from players that have accumulated fantasy points over the last three NFL seasons (2017-2019).
An example would be if we want to see how strong of a relationship there is between passing touchdowns and PPR fantasy points for players at the quarterback position. We know that touchdowns are important in fantasy, but this work can quantify, or put a number to, just how important passing touchdowns are to scoring PPR fantasy points. By running the correlation for all the quarterbacks in the last three years, we get a number of .881 or about 88%. The closer to 1 or 100% the number is, the stronger the relationship between the two statistics. If you intuit this, it makes sense that passing touchdowns would have a strong relationship with fantasy points because when looking at scoring for most leagues, passing touchdowns are worth a lot of points. Also, the players that throw them the most tend to be the players with more PPR fantasy points. If you want to learn more about what we are using (which is called the Correlation Coefficient, or r ) you can go here.
For now, here are the general rules of thumb for defining the strength of the relationships between two statistics:
Correlation Coefficient Descriptors
| Range of Correlations Coefficients (%) | Description of Correlation Strength |
|---|---|
| 70%+ | Very Strong |
| 69% – 40% | Strong |
| 39% – 30% | Moderate |
| 29% – 20% | Weak |
| 19% – 1% | Negligible |
| 0% | No Correlation |
Here is a complete breakdown of statistics per skill position and their correlation to PPR fantasy points. The majority of the following statistics can be found on our partner’s website, FantasyData. Adjusted Yards Per Attempt (AY/A) and Adjusted Net Yards Per Attempt (ANY/A) were found on pro-football-reference.com.
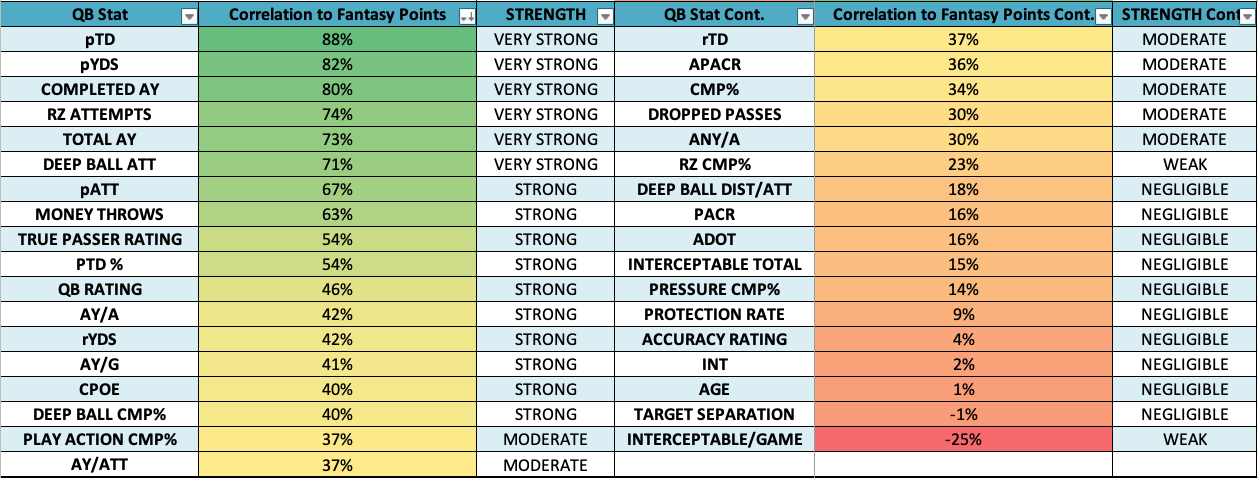
Quarterback Statistics to PPR Fantasy Points
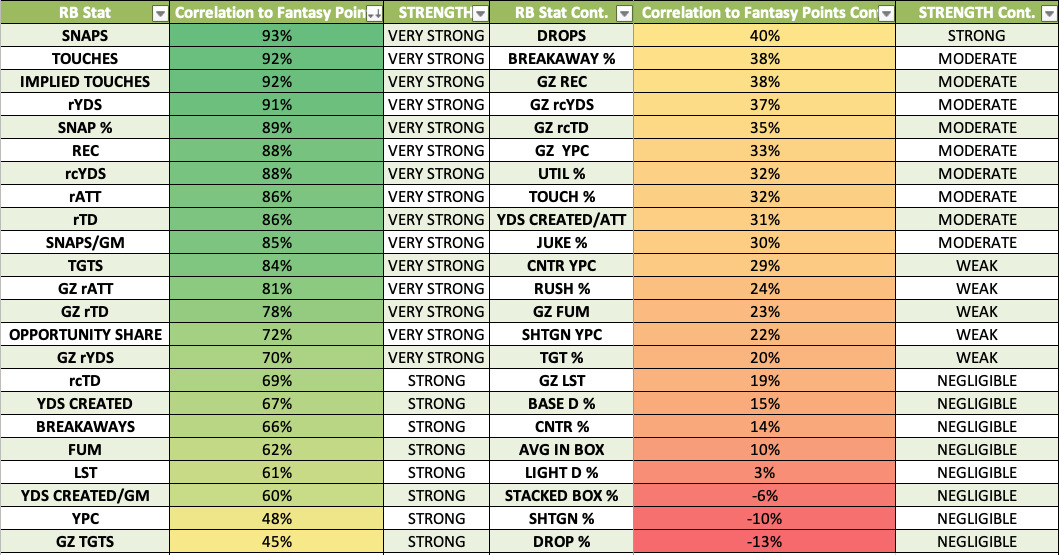
Running Back Statistics to PPR Fantasy Points
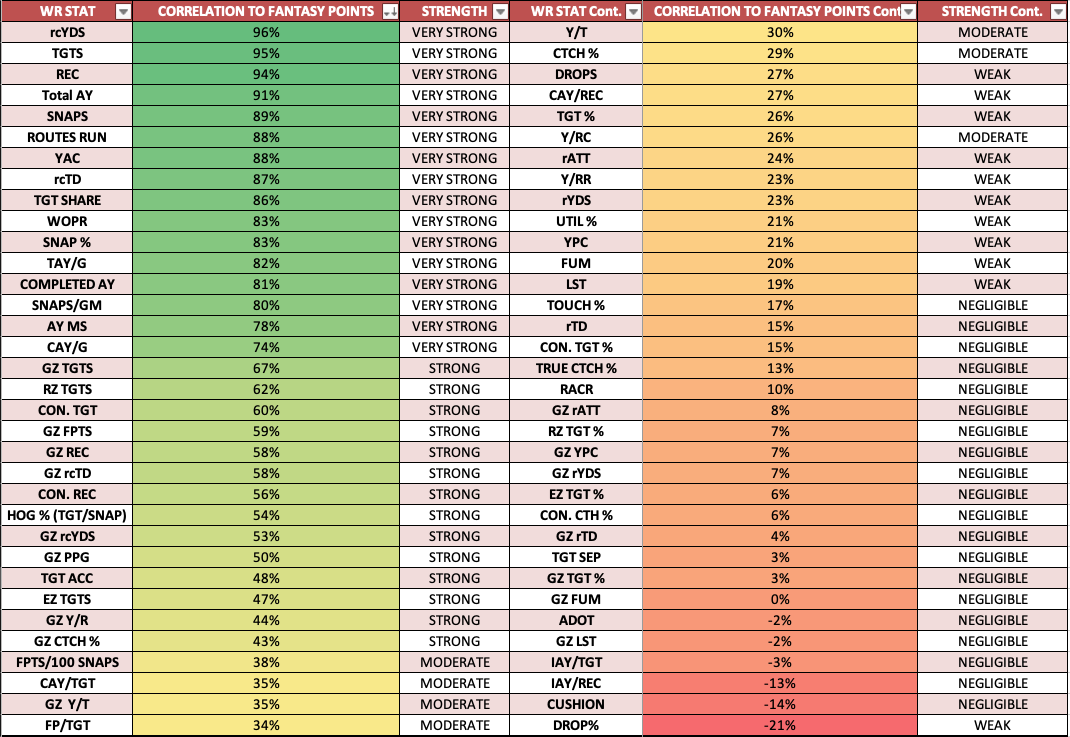
Wide Receiver Statistics to PPR Fantasy Points
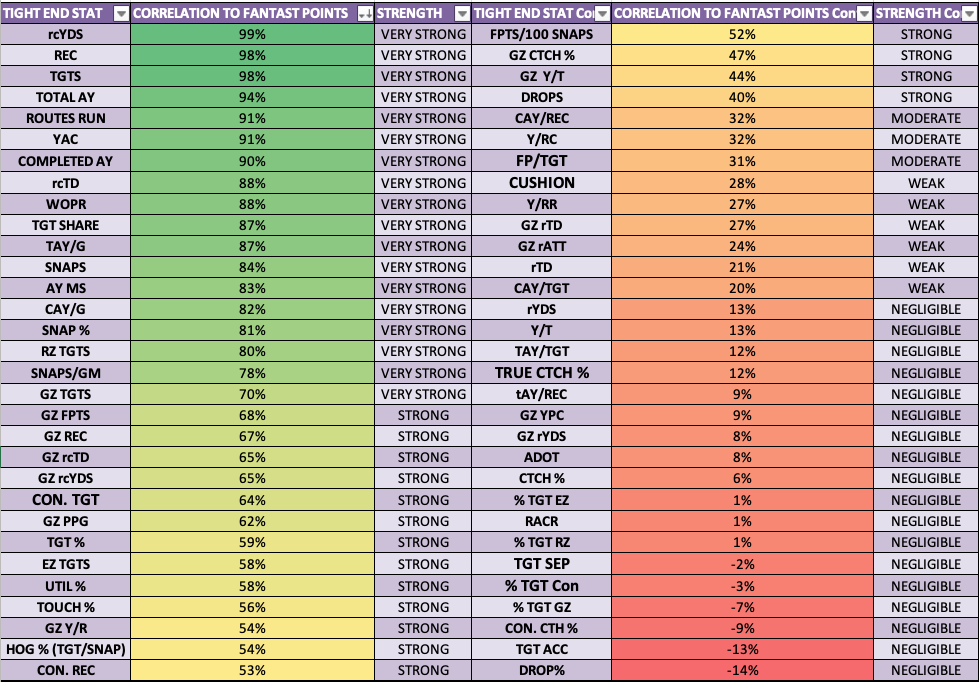
Tight End Statistics to PPR Fantasy Points
Rules of Thumb
There are two general takeaways that can be made from a quick glance over these tables before we dive into some specific stats at each skill position.
Rule 1 – League Scoring Correlates
Stats that are already built into your league scoring are going to have a high correlation to fantasy points. This may seem obvious, but the tables prove it. Statistics like passing touchdowns, rushing yards, and receptions are a part of the scoring setting for most leagues, therefore it makes sense that when you are looking at players, you should be looking at players that are performing well in those areas. However, all fantasy players are going to be doing that, so you aren’t earning yourself much of an edge by only looking at those statistics.
Rule 2 – Buy in Bulk
If you have read anything about fantasy football, you have more than likely run across the phrase “Volume is King.” This means you want your fantasy players with the ball in their hands as much as possible. Football statistics can essentially be broken into two different categories, volume stats, and efficiency stats. Volume stats focus on the total performance or role the player plays in the game. This can be measured by how often the ball is thrown to him (targets), how often he catches the ball (receptions), how many times he rushes with the ball (rush attempt), and etc. Efficiency stats measure how well the player does with those opportunities. They are usually expressed as rates (%) or using the term “per”. While it is important to be good with the ball in your hand, it does not really matter if you never get the opportunity to have the ball in the first place (volume).
Stats That Matter
In the following sections, I will take a closer look at specific stats to consider at the skill positions (quarterback, running back, wide receiver, and tight end). These stats are described as either “Very Strong” or “Strong” as measured by their correlation coefficients. I will tell you what the statistic measures, why you should use it, where you can find it, and the top three performers at the stat over the last years and where they finished in the PPR ranks. Let’s take a look.
Quarterback
Completed Air Yards (CAY)
80% Correlation to PPR Fantasy Points
Completed Receiver Air Yards measures the number of yards the ball travels in the air from the point of the quarterback’s release to the point of the catch by a receiver or tight end. The yards after the receiver catches the ball is not included in the total. The counting stops as soon as the receiver or tight end completes the catch. This stat may help you identify quarterbacks that are throwing the ball and completing the ball at a high rate. In order to tally up a high total of CAY, a quarterback is more likely to be completing passes further downfield which means more fantasy points for you. It could also mean that the quarterback is completing many short, high percentage passes as well. This is also a good thing because it means you have a player with a lot of volume/opportunity (pass attempts) to score you points and the shorter passes lower the risk of negative points for interceptions.
Where to find it: FantasyData – Advanced Metrics and PlayerProfiler
Top Performers (Player: Overall Stat Rank/PPR Points Overall Rank)
2019 – Jameis Winston: QB1/QB5, Dak Prescott: QB2/QB2, Matt Ryan: QB3/Q11
2018 – Matt Ryan: QB1/QB2, AndrewLuck: QB2/QB5, Jared Goff: QB3/QB7
2017 – Tom Brady: QB1/QB3, Russell Wilson: QB2/QB1, Ben Roethlisberger: QB3/QB10
Red Zone Attempts (RZ Att)
74% Correlation to PPR Fantasy Points
The Red Zone is the area of the field from the opponent’s 20-yard line to the endzone. This area is called the Red Zone because the team is getting closer to the endzone and an opportunity to score points. Over the last five seasons, quarterbacks could expect to throw a touchdown pass on 23.4% of their passing attempts or about every 4.3 attempts from within the Red Zone. That rate drops considerably to every 1.6% of throws or every 62.1 pass attempts between the opponents 21-yard line and the team’s own 1. That is a huge discrepancy and you want the quarterbacks that are visiting this area of the field most often to capitalize on your opportunity of scoring touchdowns.
Where to find it: FantasyData – Red Zone Data
Top Performers (Player: Overall Stat Rank/PPR Points Overall Rank)
2019 – Tom Brady: QB1/QB12, Russell Wilson: QB2/QB3, Matt Ryan: QB3/Q11
2018 – Patrick Mahomes: QB1/QB1, Jared Goff: QB2/QB7, Andrew Luck: QB3/QB5
2017 – Tom Brady: QB1/QB3, Ben Roethlisberger: QB2/QB10, Drew Brees: T-QB3/QB9, Jared Goff: T-QB3/QB12
Running Back
Snaps
93% Correlation to PPR Fantasy Points
Snaps are the quintessential opportunity statistic. It literally tells you how many snaps the player was on the field over the course of the season. The reason this is such an important stat for the running back position is the proliferation of the running back by committee. More and more teams are using multiple running backs instead of a single player on every down. As a fantasy owner, you want to keep an eye on how often your running back is seeing the field because your player cannot score you points from the sidelines.
Where to find it: FantasyData – Snap Count Data
Top Performers (Player: Overall Stat Rank/PPR Points Overall Rank)
2019 – Christian McCaffrey: RB1/RB1, Ezekiel Elliot: RB2/RB3, Leonard Fournette: RB3/RB7
2018 – Christian McCaffrey: RB1/RB2, Ezekiel Elliot: RB2/RB5, Saquon Barkley: RB3/RB1
2017 – LeVeon Bell: RB1/RB2, Todd Gurley: RB2/RB1, Carlos Hyde: RB3/RB8
Implied Touches
92% Correlation to PPR Fantasy Points
Implied touches and touches are equally correlated to PPR fantasy points on the chart above. However, the stat implied touches are preferred because it also captures an offenses intent in the statistic. While touches is a measure of how many receptions and rushing attempts the running back has implied touches replaces receptions with targets. Targets will encompass both complete and incomplete passes that were intended for the running back, hence how often the offense truly wanted to get the ball to the back, not just how often they were successful in doing so. Measuring touches through an offense’s attempts to go to the back, whether successful or not, is looking at touches through a volume-based lens instead of only counting the touch if the ball is caught. This puts an efficiency rate in play because it will be dependent on the running back’s catch rate.
Where to find it: Self-Generated (Targets+Rush Attempts), Found in my weekly Opportunity Report
Top Performers (Player: Overall Stat Rank/PPR Points Overall Rank)
2019 – Christian McCaffrey: RB1/RB1, Ezekiel Elliot: RB2/RB3, Leonard Fournette: RB3/RB7
2018 – Ezekiel Elliot: RB1/RB5, Saquon Barkley: RB2/RB1, Christian McCaffrey: RB3/RB2
2017 – LeVeon Bell: RB1/RB2, Melvin Gordon: RB2/RB5, Todd Gurley: RB3/RB1
Green Zone Attempts
81% Correlation to PPR Fantasy Points
Most people know the Red Zone, but if not read the quarterbacks section above. Not as many people know about the Green Zone, but if you are a fantasy player, you should. The Green Zone is the area between the opponent’s 5-yard line and the endzone. Jeff Ratcliffe, now of Fade The Noise, wrote at Pro Football Focus about how much greater a player’s chances are of scoring are once they enter the Green Zone. Over the last five years, running backs have scored touchdowns on about 42% of their touches within the Green Zone. That is astronomical! The next highest rate is from the opponent’s 6-10 yard line where backs score on about every 13.1% of their rushing attempts. That in itself is a good percentage but pales in comparison to the Green Zone. Monitor the backs that are getting the most volume or opportunities from within their opponent’s 5-yard line.
Where to find it: FantasyData – Red Zone Data
Top Performers (Player: Overall Stat Rank/PPR Points Overall Rank)
2019 – Dalvin Cook: RB1/RB6, Christian McCaffrey: RB2/RB1, Ezekiel Elliot: RB3/RB3
2018 – Todd Gurley: RB1/RB3, Saquon Barkley: RB2/RB1, Derrick Henry: RB3/RB16
2017 – Todd Gurley: RB1/RB1, Carlos Hyde: RB2/RB8, Mark Ingram: RB3/RB6
Wide Receiver
Targets
95% Correlation to PPR Fantasy Points
Targets are when a pass is intended for a receiver. The receiver could be a tight end, wide receiver, running back, or any other legal receiver on the play. The intended receiver is credited with a target whether they catch the ball or not. Why do you care if they get the ball thrown at them if they do not catch it? It is because targets shine a spotlight on the intent of the offense. What the coaches and quarterback want to do is attack the defense. It gives you insight into who the team thinks is it’s best players or matchups because intuitively you get the ball to your best guys. You want to get players that get targets.
Where to find it: FantasyData – Fantasy Stats – Wide Receiver/Tight End
Top Performers (Player: Overall Stat Rank/PPR Points Overall Rank)
2019 – Michael Thomas: WR1/WR1, Julio Jones: WR2/WR3, Allen Robinson: WR3/WR8
2018 – Julio Jones: WR1/WR5, DeVante Adams: WR2/WR3, Antonio Brown: WR3/WR2
2017 – DeAndre Hopkins: WR1/WR2, Antonio Brown: WR2/WR1, Larry Fitzgerald: T-WR3/WR3, Jarvis Landry: T-WR3/WR4
Total Air Yards
91% Correlation to PPR Fantasy Points
Total Air Yards encompasses the total picture of the passing game. Total air yards measure the distance the ball travels from the line of scrimmage (where the ball is snapped) to where the ball is caught (see completed air yards above) or where the ball fell incomplete. Air yards do not include any yards after the catch. Instead, imagine the play is whistled dead at the point of the catch. Although complete air yards are important, the incomplete air yards are more important. The incomplete air yards is hidden information that gives you full insight into the offense’s intent, just as targets do, except not only does it tell you who the offense wants to get the ball to, but also how far down the field the offense is trying to complete passes to the player. You will begin to develop an idea of whether the team has the receiver running short, intermediate, deep, or a mixture of these route types. This is extremely valuable information. It can also inform you as to the receivers that are important to a team’s gameplan. Chances are, the team will continue to implement their gameplan and that player will be successful in time and convert those incomplete air yards to complete air yards. You want to be there to get the points that game.
Where to find it: Airyards.com
Top Performers (Player: Overall Stat Rank/PPR Points Overall Rank)
2019 – Julio Jones: WR1/WR3, Mike Evans: WR2/WR15, Odell Beckham Jr.: WR3/WR25
2018 – Julio Jones: WR1/WR5, Mike Evans: WR2/WR6, DeAndre Hopkins: WR3/WR4
2017 – DeAndre Hopkins: WR1/WR2, Antonio Brown: WR2/WR1, Julio Jones: WR3/WR3
Weighted Opportunity Rating (WOPR)
83% Correlation to PPR Fantasy Points
WOPR is a fun mix of the two important stats that we discussed above. The stat takes the opportunity statistics of target share (what percentage of the team’s total targets does the player account for) and air yards market share (what percentage of the team’s total air yards does the player account for) and combines them in a weighted formula. The weights are used to make sure that the statistics are calculated at their proper values. It ensures that the target share is a little more than twice as important as air yards market share. WOPR is represented as a decimal (or percentage) with elite receivers typically scoring .70+. The other amazing aspect of this statistic is that it tends to be predictive of future fantasy success because of the two statistics that it’s composed of help to identify intent within the offense. If a player has a good WOPR score but has yet to produce in fantasy, that is a player worth adding on the waiver wire.
Where to find it: Airyards.com
Top Performers (Player: Overall Stat Rank/PPR Points Overall Rank)
2019 – Michael Thomas: WR1/WR1, DeAndre Hopkins: WR2/WR5, DeVante Adams: T-WR3/WR22, Allen Robinson: T-WR3/WR8
2018 – DeAndre Hopkins: WR1/WR4, Julio Jones: WR2/WR5, Odell Beckham Jr.: WR3/WR16
2017 – DeAndre Hopkins: WR1/WR2, Antonio Brown: WR2/WR1, A.J. Green: WR3/WR10
Tight End
The majority of tight end statistics, while ranked differently, were similar to those in the wide receiver chart. There was one statistic that ranked very highly that I felt needed to be discussed, although it can be difficult to find.
Routes Run
91% Correlation to PPR Fantasy Points
This stat is exactly what it sounds like. It measures how many passing routes a tight end ran over a span of time. This is important to this position because tight ends have two major roles within an NFL offense (way oversimplifies, I know) pass catch and block. You only get points for one of those in fantasy. Similar to snaps, your tight end can only catch a pass if he is on the field and he isn’t blocking. Routes run is something to pay close attention to.
Where to find it: PFF (Paywall)
Top Performers (Player: Overall Stat Rank/PPR Points Overall Rank)
2019 – Travis Kelce: TE1/TE1, Zach Ertz: TE2/TE4, Mike Gesicki: TE3/TE12
2018 – Travis Kelce: TE1/TE1, Zach Ertz: TE2/TE2, Jimmy Graham: TE3/TE12
2017 – Jimmy Graham: TE1/TE6, Rob Gronkowski: TE2/TE2, Travis Kelce: TE3/TE1
(Photo by Gavin Baker/Icon Sportswire)
Is there a glossary anywhere for what some of these stats are?
Excellent info for someone who is definitely into forecasting fantasy football outcomes utilizing spreadsheet data. Thanks for the education on relevant data.
Great breakdown of the key stats! I always struggled to understand which metrics truly impact player performance in fantasy. This guide really clarified things for me, especially the emphasis on completion percentage and touchdown-to-interception ratio for QBs. Thanks for sharing these insights!
Great insights on quarterback stats! I particularly appreciated the breakdown of how each stat impacts fantasy scoring. It really helped clarify which metrics to prioritize in my drafts. Looking forward to applying this knowledge in my upcoming league!
Great insights! I never really considered how much the offensive line impacts a QB’s stats. It’s definitely something I’ll keep in mind during my draft. Thanks for breaking it down!