
Photo by Gavin Baker/Icon Sportswire
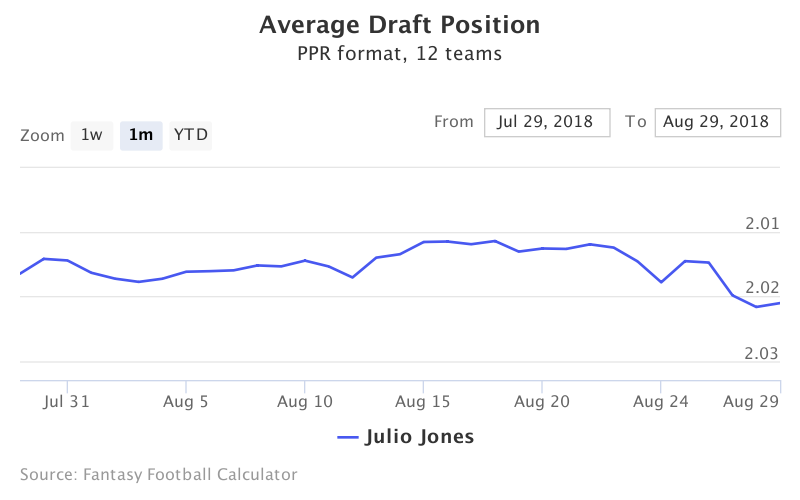
What just happened? Julio Jones just went 17th overall in my 12 team PPR draft. With the way running backs are coming off the board this year, I was starting to think he may make it back to me with pick 21. Alright. That’s probably wishful thinking, but at pick 17, we are not too far from his average ADP since the end of July. According to Fantasy Football Calculator, Jones has been posted on draft boards on average around pick 14 in 12 team PPR leagues.
This is the first time since drafting for the 2014 season (The year after breaking his foot and ending his 2013 season in early October) that Julio Jones’ ADP has been outside the top 10. Just last year, he was drafted on average at spot number 5. When framed in this light, I can see why the hashtag #NeverJulio was so rampant last season (Although some were joking). If you spent that kind of draft capital on him, you expect great fantasy production. Not to mention the names that were behind him in ADP last year were the names synonymous with league winners: Rob Gronkowski (ADP 18.1), Kareem Hunt (ADP 18.7), and Todd Gurley (ADP 19.4).
I’ll state the obvious, Julio had a bad fantasy year last season. I’m a Julio fan and have had him as a keeper in my longest running league since his rookie year, but when I think back to last season, all I remember is this:
[gfycat data_id=”RepentantSparseDunlin”]
Ya…that was a remote tosser. That clip embodies some of the biggest complaints you hear against Jones.
- He doesn’t score a lot of touchdowns. (See above)
- He has too many drops. (See above)
You know what? You’re right with these statements, but despite all these statements he still has averaged 250 PPR points per season in his career and 167 points per season in standard scoring. And with all those points, you have drops and only one double-digit touchdown season baked in.
If we could dig a little deeper and see that last year may have been a statistical outlier when it comes to touchdown production, then you may just have an edge over your friends that have moved on from Jones. Let’s take a look, shall we?
The ever elusive touchdown. It was something of a rare event last year for Julio fantasy owners. In fact, two of the three came in his monster, 253-yard, week 11 game against Tampa Bay and the other came in garbage time against New England in week 6. It was Julio’s worst performance in racking up touchdowns in his seven-year career in which his season was not cut short by injury. (In 2013 he ended his year with two TD after going on season-ending IR in October.) However, if you were to take out last year as an outlier and his injured season, Jones would average 7.6 TD per season. This is by no means top tier but it is icing on the proverbial fantasy football cake when you take into account everything else Julio brings to the table as far as points are concerned. Julio has been a top 10 and very nearly a consistent top 5 receiver in points dating back (DING) to 2014, which statistically is his breakout year.
| Season | Standard Points | Rank | PPR Points | Rank | TD Totals |
| 2017 | 164 | WR 5 | 252 | WR 7 | 3 |
| 2016 | 177 | WR 6 | 260 | WR 6 | 6 |
| 2015 | 232 | WR 2 | 368 | WR 2 | 8 |
| 2014 | 193 | WR 8 | 297 | T-WR 6 | 6 |
*Stats from Pro Football Focus
You are able to get consistent top 8 wide receiver production from Jones and he does not need to be touchdown dependent. That is an extremely high floor without chasing touchdowns, but complaint three above gives us a hint that the opportunities for positive touchdown regression are coming.
If you read any football articles or websites in which advanced analytics are used, you know that the industry’s white whale is the ability to project, with reliability, a player’s likelihood to score a touchdown from year to year. Touchdowns are chaotic when you try to pin them down with statistics. As fantasy players, we know that touchdowns are what can make or break your week, so analysts much smarter than I have been chipping away at ways to identify what correlates to a player scoring a touchdown. Some of the latest advanced metrics try to boil touchdowns down to one word: Opportunity.
A lot goes into that one word so I will let Scott Barrett, of Pro Football Focus, explain his Actual Opportunity (AO) metric and Mike Clay can explain his Opportunity-Adjusted Touchdown (OTD) metric. For a quick summary, these metrics measure how many touchdowns a player should score based on the opportunities he has such as down and distance, the line of scrimmage, and depth of the target. There is a lot more to them and I recommend looking into them, but let’s focus on what we can glean from their measures.
The measures verify what we already know, Jones underperformed in the area of touchdown totals.
| Total TD Scored | AO Total Expected TD | Difference | oTD | Difference |
| 3 | 10 | -7 | 8.4 | -5.4 |
*Stats from Pro Football Focus and ESPN
According to Barrett’s AO calculations, Julio should have expected to see a touchdown total of 10 based on the volume and opportunities he was presented with. Clay’s model says that he should have scored around 8 touchdowns last year. This falls closer in line with Julio’s career seasonal average that we stated above of 7.6.
Last year was not just an outlier in Jones’ career, but it was an outlier in NFL history. According to Barrett, only one other player has had a season in which they had a greater differential between what they had the opportunity to score (10 TD) vs. what they scored in actuality (3 TD). The very next season, that players touchdown rate increased by five.
These numbers tend to gravitate back towards the mean from the polar extremes. The data is indicating that (even with Sarkisian calling the plays) the offense in place is providing Jones with the opportunities necessary to score touchdowns and opportunity is one of the best ways to predict future touchdown production.
There’s just one more thing to cover: volume. In order for these opportunities to persist, we do need to ensure that Jones is going to get the targets he needs to capitalize on those opportunities. Right? Well, Julio has been a target monster for his entire career averaging 127 per season. He’s not just running curl routes either. His career average depth of target (aDOT) is 12.7 yards. That’s an entire yard deeper than league average since he entered the league. Typically you would expect a lower catch rate for someone that runs deeper routes because the deeper the route the further the ball is thrown and the more difficult it is to complete. However, Julio’s 62% catch rate last season held up remarkably well against other receivers with a similar aDOT and at least 40 receptions.
| Name | Targets | Receptions | Catch % | aDOT | Yards Per Target | Fantasy Points Per Opportunity |
| Antonio Brown | 155 | 101 | 65% | 15 yd. | 9.9 | 0.57 |
| Julio Jones | 143 | 88 | 62% | 14.8 yd. | 10.1 | 0.54 |
| Brandin Cooks | 109 | 65 | 60% | 15.9 yd. | 9.9 | 0.35 |
| Martavis Bryant | 81 | 50 | 60% | 15.4 yd. | 7.4 | 0.29 |
| Tyrell Williams | 63 | 43 | 63% | 14.3 yd | 10.7 | 0.27 |
*Stats from Pro Football Focus
Only Antonio Brown had a higher aDOT and catch percentage than Julio last year. That is good company to keep, especially for a down season. He also ranked tied for second behind Brown in Fantasy Points Per Opportunity (FPPO) as measured by Pro Football Focus. That takes a player’s fantasy points and divides it by carries and pass routes that they ran. Over the course of the season, spreading out Julio’s fantasy points means you get 0.54 fantasy points for every passing route he runs. (He doesn’t carry the ball much, but those are technically in there too.) That figure over his career has stayed consistent as well with an average of 0.52 FPPO. Julio Jones has the track record that shows that the volume is coming his way.
The Bottom line for future and current Julio owners:
[gfycat data_id=”BossyConcreteEmperorshrimp”]
#ForeverJulio