
The Magnetic Pull of the Mean
Every year players on your fantasy team score you points. You have your league winners. These are the players that outperform what was expected of them based on where you acquired them, whether in the draft, waiver wire, or trade. Then you have your team tankers. These are the players that crushed your team’s hopes because they did not perform up to the expectations.
One of the most fun things about fantasy football is that every year you can start fresh and use what you learned from last year to make your best guess as to what is going to happen in the upcoming season. Regression to the mean is a way that you can gain an edge on your opponents. Think of the mean, or average, as a magnetic pull. All fantasy players are being pulled towards the mean. Some players, the league winners, have such a strong force towards above-average performances that they will continue to score above average points for your team. Some players, the team tankers, have such a strong force towards below-average performances that they will continue to score below average point totals for your team.
Eventually, just like father time (I’m sure there is a strong correlation), the magnetic force of the mean always wins out. Players performing above average start to creep back or even slingshot back toward the magnetic pull of average play. The same, thankfully, for the opposite. Players that are performing below average for fantasy teams will inevitably make their way back toward the magnetic center of the mean.
Identifying which players have been under-performing in regards to the mean will help you decide the players that you want to invest in, as other fantasy owners believe that their below-average performance of the past is permanent. Alternatively, identifying over-performing players will help you avoid those with no hope of keeping up that above-average pace and no hope of escaping the tractor beam that is the mean.
The Process
This series of articles will focus on arguably the most exciting part of both real and fantasy football, the touchdown.
Touchdowns are notorious for being “not sticky” or unpredictable from season to season. This means we can not look at Dak Prescott’s 30 passing touchdowns last season and pencil him in for the same amount in 2020. You can’t even rely on his touchdown rate to repeat itself. According to T.J. Hernandez at 4for4.com, passing touchdowns have a correlation season to season of just .36, and touchdown rate is even lower with a season to season correlation of .21.
Instead of looking for an exact touchdown total for quarterbacks in the 2020 season, let’s go back to what we talked about at the top. Let’s see which quarterbacks underperformed and overperformed in the touchdown column in the 2019 season.
We know that the magnetic pull of the mean is endless. Some players regress more than others. Yes, this even applies to unicorns like Patrick Mahomes. The measures that predict how many touchdowns a quarterback should score (what I call Expected Touchdowns) is measure through passing yards and rushing attempts. Looking at the tables below, you will be able to see the r-square values for passing yards per touchdown and rushing attempts per touchdown for the quarterback position. What this r-squared value means, in simplest terms, is how much one variable (passing yards) explains (correlates) to another variable (passing touchdowns). If you want to know a more in-depth explanation, you can read about it here.
Dating back to the 2015 season, here are the correlations between quarterback passing yards and passing touchdowns:
| Year | Passing Yards | pTD | pYds/TD |
|---|---|---|---|
| 5-year Trend | 161.2 | ||
| r-squared | 0.54 | ||
| 2015 | 128,007 | 823 | 155.54 |
| 2016 | 130,585 | 779 | 167.63 |
| 2017 | 121,080 | 734 | 164.96 |
| 2018 | 129,644 | 834 | 155.45 |
| 2019 | 128,461 | 791 | 162.40 |
Dating back to the 2015 season, here are the correlations between quarterback rush attempts and rushing touchdowns:
| Year | rAtt | rTD | rAtt/TD |
|---|---|---|---|
| 5-year Trend | 25 | ||
| r-squared | 0.59 | ||
| 2015 | 1,575 | 59 | 26.69 |
| 2016 | 1,523 | 65 | 23.43 |
| 2017 | 1,641 | 65 | 25.25 |
| 2018 | 1,834 | 69 | 26.58 |
| 2019 | 1,825 | 80 | 22.81 |
In some areas of statistics, an r-squared value of .54 would be considered pretty weak, to very weak, but not in football. In football, there are a lot of variances and a correlation of .3-.7 is moderate. Any correlation that is greater than .7 would be considered strong. As you can see from the r-squared value, the variables of passing yards and passing touchdowns for the quarterback position are moderate. The same can be said for rushing attempts to rushing touchdowns for the quarterback position.
Using this information, we can feel comfortable using these conversions to help find 2019 touchdown overperformers and underperforming at the quarterback position. The next question becomes how much should we expect the player to be pulled back toward the mean. To try and put this into perspective, we will look at the player’s historical trends in their efficiency of converting their total expected touchdowns (eTD) into actual touchdowns (aTD). If 2019 looks like an outlier based on their previous season’s efficiency of converting passing yards and rushing attempts into touchdowns than we should expect regression to hit in 2020.
Without further to do, 2020’s top quarterback regression candidates.
2019 Under-Performers: More Touchdowns (and Value) on the Horizon
Philip Rivers, Indianapolis Colts
Philip Rivers threw for 23 touchdowns (apTD) in 2019. He added 0 touchdowns (arTD) with his legs which is something we’ve come to expect from the aging, but never nimble, quarterback. Based on his passing yards and rushing attempts, Rivers was expected to throw for 31 touchdowns (epTD) and rush for no touchdowns (erTD). Based on his numbers, he should have had a total of 31 touchdowns (eTD) last season instead of the 23 he ended with (aTD). That’s a conversion of just 73% of his total touchdown potential from last season. Depending on how your league scores passing touchdowns, Rivers left either 32 or 48 more points on the field for fantasy owners last season.
| Passing Yards | apTD | epTD | apTD/epTD | rAtt | arTD | erTD | arTD/erTD | Actual Total TD | Total Expected TD | aTD/eTD |
|---|---|---|---|---|---|---|---|---|---|---|
| 4615 | 23 | 31 | 0.74 | 12 | 0 | 0.5 | 0 | 23 | 31.48 | 0.73 |
The question now is if this failure to convert yardage into touchdowns is this an outlier based on Rivers’ history?
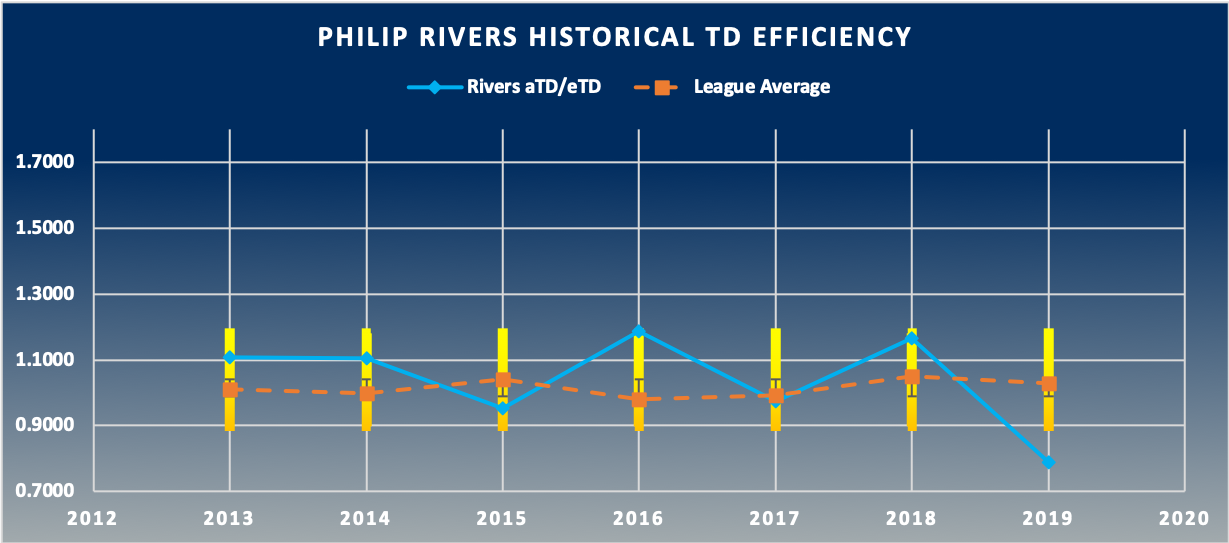
Looking at the chart, over the last six seasons, Rivers has always been above 90% conversion of expected touchdowns (based on passing yards and rushing attempts) into actual touchdowns. He’s been efficient, to say the least, always hovering just above or below the league mean. The yellow bars represent a standard deviation for Rivers, based on this data. You can see where he falls each year within his ability to convert, essentially only passing yards since he does not run, into touchdowns. The years 2013, 2016, and 2018 were especially efficient for Rivers, as he converted near the top of his range. When looking at 2019, you notice that his touchdown efficiency is below his average standard deviation. This tells us that 2019 was an outlier season and we should expect a bounce back.
Verdict: It should be safe to invest in Rivers in 2020. Even with the change in scenery, history tells us he should have a better season more in line with his 99% actual touchdown to expected touchdown average since 2013.
Jared Goff, Los Angeles Rams
Jared Goff had a disappointing season in 2019. Another pocket passer that amassed the majority of his touchdowns through the air, Goff underperformed with just 21 passing touchdowns on 4,638 yards through the air. He was able to add on two rushing touchdowns which outperformed his expectations with only 33 rushing attempts on the year.
| Passing Yards | apTD | epTD | apTD/epTD | rAtt | arTD | erTD | arTD/erTD | Actual Total TD | Total Expected TD | aTD/eTD |
|---|---|---|---|---|---|---|---|---|---|---|
| 4638 | 22 | 28.77 | 0.76 | 33 | 2 | 1.3 | 1.52 | 24 | 30.09 | 0.80 |
Given the yardage and rushing attempt totals, Goff was expected to score 32 total touchdowns last season. He should have had approximately seven more touchdowns through the air as he converted only 76% of his expected passing touchdowns. However, historically, we would see Goff score one less touchdown on the ground than he did in 2019. He was very efficient on the ground scoring touchdowns, converting at 152% of what was expected. For fantasy owners, depending on scoring, Goff left 24 or 36 fantasy points on the field for you last season.
Let’s take a look and see if, historically, 2019 was an outlier for Goff when it comes to converting expected touchdowns into actual touchdowns.
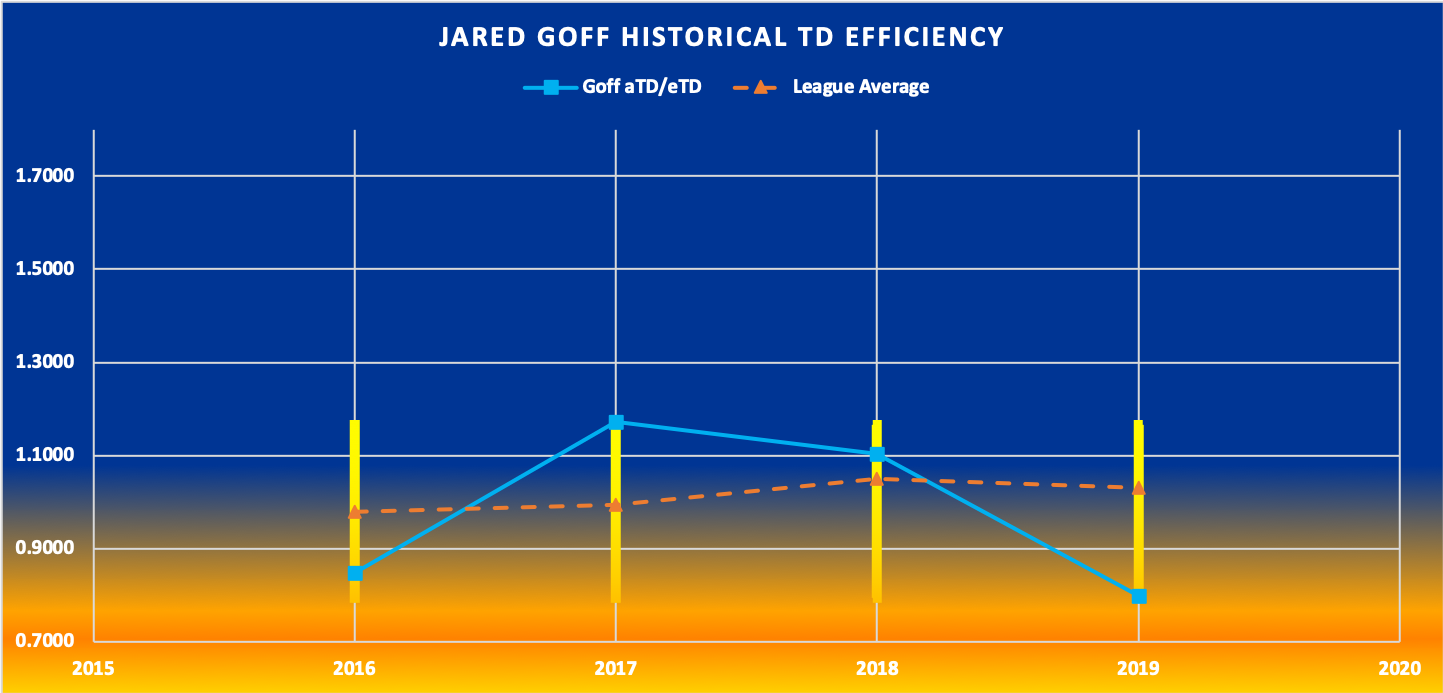
Last season was indeed Goff’s worst year at converting expected touchdowns, though he saw a similar low-efficiency year in his rookie 2016 season. Although Goff only started seven games that season, he was only able to covert five of his expected seven touchdowns, or 74%. In 2019, Goff converted 22 of his 29 expected passing touchdowns or 76%. In the seasons following 2016, Goff went from below average, to above average in total expected touchdown conversions, with 2017 being particularly strong. Whether he was above or below, Goff has never been as far from league average as he was in 2019.
Verdict: Expect Goff to rebound in the touchdown column. He should be much closer to his expected touchdown conversion rate of 104% that we saw in his career prior to his dismal 2019 season.
Derek Carr, Las Vegas Raiders
Derrek Carr improved by most accounts in his second year in Jon Gruden’s offense. According to airyards.com, when comparing Carr’s 2018 and 2019 seasons, he improved in completion percentage, completion percentage over expected, yards, touchdowns, yards, PACR, and aPACR. The last two metrics being the stickiest measures of quarterback efficiency. By all accounts, it was a better year.
Another area Carr improved was converting expected into actual touchdowns. His 2018, was the lowest I charted in this exercise. He was only able to convert 77% of his total expected touchdowns based on his passing yards and rushing attempts in 2018. Needless to say, he had nowhere to go but up in 2019, and he did regress towards the mean, but his touchdown scoring efficiency was still below league average.
| Passing Yards | apTD | epTD | apTD/epTD | rAtt | arTD | erTD | arTD/erTD | Actual Total TD | Total Expected TD | aTD/eTD |
|---|---|---|---|---|---|---|---|---|---|---|
| 4054 | 21 | 25 | 0.84 | 27 | 2 | 1 | 1.85 | 23 | 26 | 0.88 |
According to Carr’s passing yards, he should have scored fantasy owners 25 touchdowns. Instead, he was only able to pass for 21. He was, however, very efficient in his rushing opportunities as he was able to score two rushing touchdowns when only one would be expected on his 27 attempts. In the big picture, Carr owed fantasy owners three more touchdowns than he scored.
So will this happen again? Let’s take a look at how efficient Carr has been at converting yards and rushing attempts into the touchdowns we would expect in seasons past.
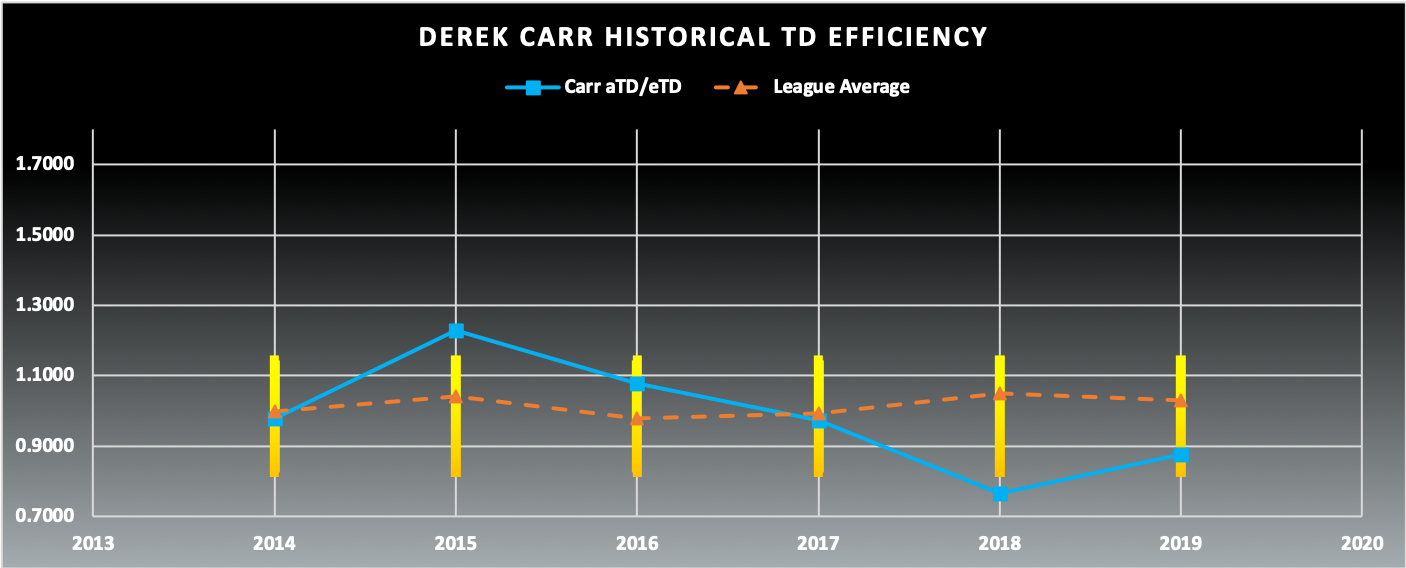
Carr’s last three seasons have been the complete opposite of his first three years in the league. While Carr started off average to above average at converting expected touchdowns into actual touchdowns, his efficiency has taken a nosedive since 2016. The positive trend back towards the mean is good, but I am wary that he can put together two seasons in a row of regression back towards the mean and being more efficient.
Verdict: Carr has shown in the past that he can be efficient in converting passing yards and rushing attempts into touchdowns, however, recent history has shown quite the opposite. The Raiders have upgraded their receiving corps and have one of the best offensive lines in football, so the elements are there but proceed with caution.
Honorable Mentions
Here are the rest of the potential 2020 starting quarterbacks (if Mitch Trubisky or Dwayne Haskins start) that left at least two touchdowns on the field in 2019.
| Passing Yards | apTD | epTD | apTD/epTD | rAtt | arTD | erTD | arTD/erTD | Actual Total TD | Total Expected TD | aTD/eTD | |
|---|---|---|---|---|---|---|---|---|---|---|---|
| Kyle Allen | 3322 | 17 | 21 | 0.82 | 32 | 2 | 1 | 1.56 | 19 | 22 | 0.87 |
| Kyler Murray | 3722 | 20 | 23 | 0.87 | 94 | 4 | 4 | 1.06 | 24 | 27 | 0.89 |
| Mitchell Trubisky | 3138 | 17 | 19 | 0.87 | 48 | 2 | 2 | 1.04 | 19 | 21 | 0.89 |
| Dwayne Haskins | 1365 | 7 | 8 | 0.83 | 20 | 0 | 1 | 0.00 | 7 | 9 | 0.76 |
| Matt Ryan | 4466 | 26 | 28 | 0.94 | 34 | 1 | 1 | 0.74 | 27 | 29 | 0.93 |
| Gardner Minshew | 3271 | 21 | 20 | 1.03 | 67 | 0 | 3 | 0.00 | 21 | 23 | 0.91 |
Check back in next week for the top overperformers of 2019; the quarterbacks whose touchdown numbers just can’t be sustainable.
All stats for this article are from profootballreference.com.
Photo by Jevone Moore/Icon Sportswire