
The Magnetic Pull of the Mean
Every year players on your fantasy team score you points. You have your league winners, which are the players that outperform what was expected of them based on where you acquired them through the draft, waiver wire, or trade. Then you have your team tankers, or the players that crushed your team’s hopes because they did not perform up to expectations.
One of the fun things about fantasy football is that every year you can start fresh. Managers take what they learned last year to make their best guess to what will happen in the upcoming season. A great tool to help gain an edge on your opponents is called regression to the mean.
Think of the mean, or average, as a magnetic pull. All fantasy players are being pulled towards the mean. Some players, the league winners, have such a strong force towards above-average performances that they will continue to score above average points for your team. Some players, the team tankers, have such a strong force towards below-average performances that they will continue to score below average point totals for your team.
Eventually, just like father time (I’m sure there is a strong correlation), the magnetic force of the mean always wins out. Players performing above average start to creep back slowly or even slingshot quickly back toward the magnetic pull of average play. The same can be said for players that are performing below average for fantasy teams. They will inevitably make their way back toward the magnetic center of the mean, or average play.
Identifying which players have been under-performing in regards to the mean will help decide the players to invest in, as other fantasy owners believe that their below-average performance of the past is permanent. Alternatively, identifying over-performing players will help avoid those players with no hope of keeping up their above-average pace. There is no hope of escaping the tractor beam of the mean.
The Process
This series of articles will focus on arguably the most exciting part of both real and fantasy football, the touchdown.
Touchdowns are notorious for not being “sticky.” They are unpredictable from season to season. We can not look at Derrick Henry’s 18 total touchdowns last season and pencil him in for the same amount in 2020.
Instead of projecting an exact touchdown total for running backs in 2020, let’s see which running backs underperformed and overperformed in the touchdown column in the 2019 season. This will give us an idea of which players are valued too high, too low, or just right.
We know that the magnetic pull of the mean is endless. The measures that predict how many touchdowns a running back should score (what I call Expected Touchdowns) is measured through rushing attempts and receiving yards. The tables below identify the r-squared values for rushing attempts per touchdown and receiving yards per touchdown for the running back position. What this r-squared value means, in simplest terms, is how much one variable (rushing attempts) explains (predicts) another variable (rushing touchdowns). If you want to know a more in-depth explanation, you can read about it here.
A straight conversion of rushing attempts and receiving yards will not give us an accurate picture. A key factor in how likely a player is to score is a touchdown is where their opportunity takes place on the field. Jeff Ratcliffe, currently of Fade the Noise, looked at the likelihood a running back was to score a touchdown when given a carry within the red zone. He found running backs are far more likely to score within the opponent’s 5-yard line, what he termed the “green zone.”
Armed with this understanding, let’s take a look at a player’s chances of scoring a touchdown from a rushing attempt at different sections of the field.
| Field Position | rAttempts | rYards | Touchdowns | TD% |
|---|---|---|---|---|
| 1-5 | 3075 | 3203 | 1294 | 42.08% |
| 6-10 | 2203 | 6445 | 289 | 13.12% |
| 11-15 | 2398 | 8713 | 142 | 5.92% |
| 16-20 | 2444 | 9757 | 80 | 3.27% |
| 21-50 | 18606 | 84466 | 169 | 0.91% |
| 49-1 | 37560 | 171946 | 95 | 0.25% |
| RZ | 10120 | 28118 | 1805 | 17.84% |
| Not GZ | 63211 | 281327 | 775 | 1.23% |
| Overall | 66286 | 284530 | 2069 | 3.12% |
Players rushing the ball hit paydirt at a good rate from the famed red zone, but the green zone is where players see their probability go through the roof. This is an important find in itself and one a fantasy manager should be aware of, but we are going to make a mental note and use these touchdown rate findings to identify players that have over and underperformed in the touchdown column in 2019.
Before we can identify running backs, we have to take a look at the other, more valuable part, of the running back’s game for fantasy purposes. In order to identify running backs that over and underperformed in total touchdowns, we have to know if they scored too many or too few touchdowns in the receiving game based on their receiving yardage and field position. In the receiving game, receiving yards predict receiving touchdowns slightly better than targets (r-squared of .65 v. .64), so we will use yards when looking at historical touchdown rates. Here is the same chart we saw for touchdown rates for rushing attempts based on field position, except now with receiving yards based on field position.
| Field Position | Target | Rec | rcYD | rcTouchdowns | TD% (TD/rcYD) |
|---|---|---|---|---|---|
| 1-5 | 2415 | 1294 | 3357 | 1096 | 32.65% |
| 6-10 | 2564 | 1402 | 8576 | 739 | 8.62% |
| 11-15 | 3042 | 1806 | 14265 | 523 | 3.67% |
| 16-20 | 3258 | 1941 | 18582 | 382 | 2.06% |
| 21-50 | 25917 | 16572 | 192443 | 924 | 0.48% |
| 49-1 | 48921 | 33437 | 405236 | 340 | 0.08% |
| RZ | 11279 | 6443 | 44780 | 2740 | 6.12% |
| Not GZ | 83702 | 55158 | 639102 | 2908 | 0.46% |
| Overall | 86117 | 56452 | 642459 | 4004 | 0.62% |
Once again it’s worth making a mental note for the green zone. It is almost as potent in the passing game as in the rushing game. However, now that we have the touchdown rates for both rushing and receiving, we can determine which players are scored too many or too few touchdowns based on how many touchdowns they scored from different parts of the field.
Without further to do, 2020’s top running back regression candidates.
2019 Under-Performers: More Touchdowns (and Value) on the Horizon
Leonard Fournette, Jacksonville Jaguars
Leonard Fournette finished 2019 as RB7 in PPR scoring. That was bolstered by his typical workhorse load in the running game, but surprising 100 targets on the season. The opportunity was there for Fournette to be a top 5 back last season because based on his 265 rush attempts and 522 receiving yards, Fournette should have scored approximately eight more touchdowns. That’s good for another 48 points which would have vaulted him over Dalvin Cook and Derrick Henry for a finish at RB5. Let’s take a look at where Fournette left points on the field and if this is a trend or an outlier.
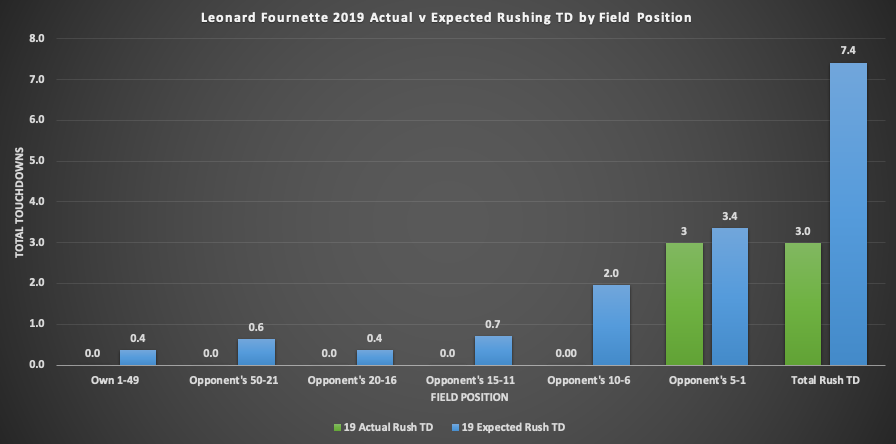
What was unusual last season was Fournette’s inability to score from anywhere else. Fournette should have scored at least 4 more touchdowns on the ground, based on his attempt totals, especially with a large amount of volume he received between the opponent’s 10 to the 6-yard line. That is the next easiest place to score on the field, with rushing attempts turning to paydirt on 8.62% off caries between those yardage markers.
I made a receiving chart like the one above, but I will save you the time of analyzing it. Fournette scored 0 touchdowns through the air. Typically, backs with Fournette’s amount of receiving yardage would have scored approximately 3.1 touchdowns.
What are we to do with Fournette in 2020? He saw fantastic volume in 2019, however, very few running backs in history have done less with the same amount of volume. Was 2019 a matter of extreme touchdown variance or is Fournette not great at scoring touchdowns?
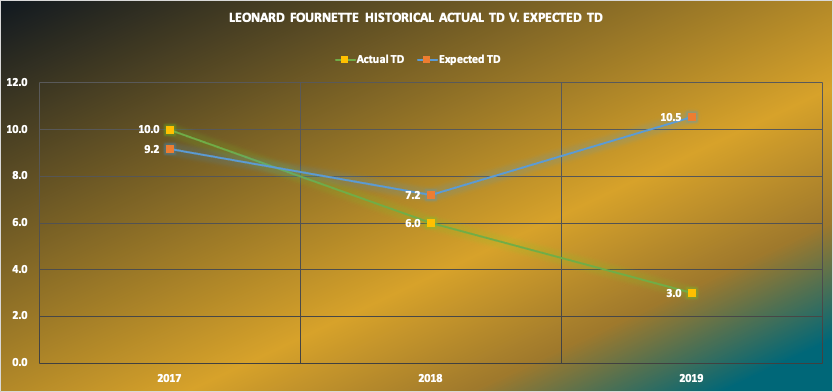
It looks to be the latter. Fournette has been in a steady decline is touchdown production since his rookie season. In 2017 he scored +0.8 actual touchdowns than what was expected. Since then he has been in a rapid decline. The good news is the only way for his actual touchdown trend line to go even lower would be through not playing or injury. There should be touchdown regression here.
Verdict: As fantasy managers, it is in our best interest to chase volume and signs still point to volume going to Fournette in the Jacksonville backfield. He will most likely see a decrease in targets as he was so inefficient with those opportunities last season. New OC Jay Gruden has brought in Chris Thompson to help relieve him of his pass-catching duties on third down. Despite the terrible feeling it may evoke, the math says if the volume is there, Leonard Fournette will see touchdown regression and can be expected to be more in line with his 2018 numbers. Draft him at his current ADP.
Joe Mixon, Cincinnati Bengals
Joe Mixon’s 2019 was a tale of two seasons. Before the Bengals’ bye week in Week 9, Mixon was a top 12 running back just twice. In the other six games before the bye, he failed to ever reach RB2 status, finishing outside of the top 24 running back ranks in PPR scoring. Once returning from the bye in week 10, Mixon finished the final eight games as the RB5 in PPR scoring. What was the big difference between the first half Mixon and the second half Mixon? You guessed it, touchdowns. Let’s take a look at where he was most effective in scoring on the field of play.
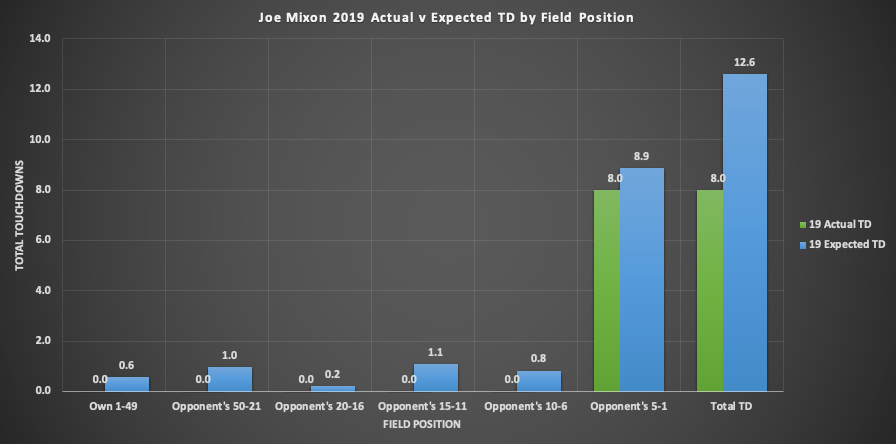
Not unlike Fornette, Mixon scored all his rushing and receiving touchdowns where we would expect our backs to score, within the green zone. Based on the rushing volume and receiving yardage totals, Mixon should have scored more in the range of 12 to 13 touchdowns. Mixon was one of the most elusive runners in football last year with a 32.9% Juke Rating at FantasyData.com. He evaded a league-leading 103 tackles and finished tied for second with 576 yards created which measures the number of yards Mixon was able to generate on his own after the first evaded tackler. Despite the elusiveness, Mixon finished 33rd in Breakaway Rate which measures how frequently a back can break a run for a total of 15-yards or more. The lack of big-play ability showed in the touchdown column as Mixon was only able to punch it in from close. The elusiveness and lack of big-play profile scream of poor line play which can further be supported by their 31st overall rank in run blocking at Pro Football Focus. Can we expect more of the same in 2020?
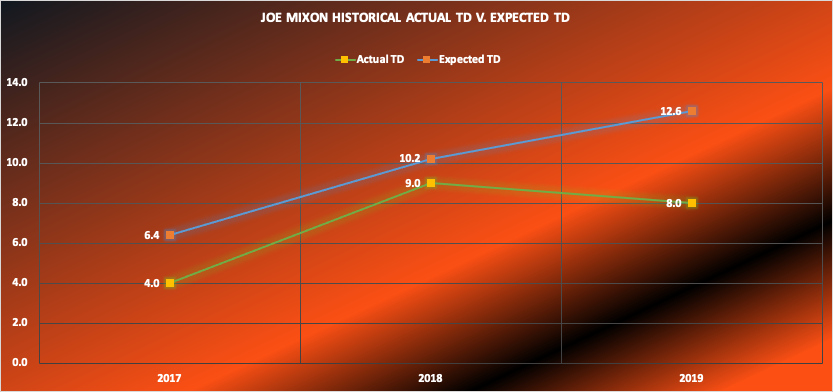
Over the course of his career, Joe Mixon has never met his expected touchdown rates. Prior to 2019, he’s only been below expected an average of 1.8 touchdowns, which is manageable. The chasm between expected and actual touchdowns was an outlier. Despite his 8 total touchdowns in the green zone, he was expected to score about 2.5 more touchdowns based on the number of attempts he handled within the five. That is easily the worst mark of his career, with the largest number of touchdowns he’s left on the field rushing in the green zone in season’s past has been .09.
Verdict: The rushing inefficiency in the green zone should not repeat itself in 2020, as 2019 was by far Mixon’s worst year converting from that area of the field. With improved offensive line play and an improved passing game to complement the rushing attack, Mixon should regress back to the mean and score his managers more touchdowns in 2020. Draft with confidence and hope bad luck doesn’t strike the Bengals offense.
David Montgomery, Chicago Bears
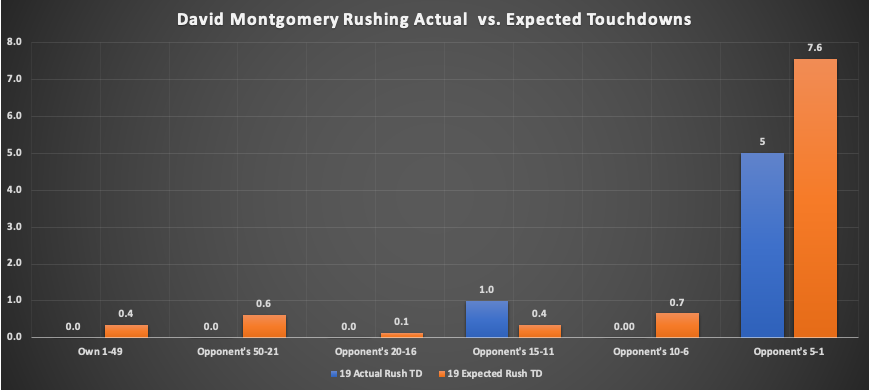
When looking at his rushing attempts, Montgomery left too many touchdowns on the field when in the green zone. He tied for third (with Mixon) for all running backs for rushing attempts in the green zone with 18 attempts. That’s a conversion rate of only 33%. Although he was able to score from between the 11 and 15-yard lines, Montgomery was not an effective rusher within the red zone. According to Sharp Football Stats, Mongomery finished 39th in rushing success rate within the red zone of those runners that had at least 11 rushes. He had a successful rush attempt at 39% of the time (13/39) which is not what you want in that area of the field.
As an overall rusher, Montgomery posted average numbers demonstrating his elusiveness. He finished as RB17 in yards created and RB13 in Juke Rate according to Fantasydata.com. He had one of the lowest breakaway rates, busting runs of 15 yards or over on only 2.1% of his carries. This was despite, on average, seeing 6.5 men in the box and light fronts 51.7% of the time according to FantasyData. His offensive line was not great, but not the worst, as it finished 20th in PFF’s ranks. Once again, the opportunity for Montgomery was there and he failed to capitalize.
Verdict: David Montgomery saw RB1 volume in 2019 but was unable to put the ball in the end zone. Chicago did not bring in any competition for touches at the running back position, so look for the volume to continue in 2020. If the volume continues, Montgomery should score you a few more touchdowns. Be wary of this one, however, as there is less historical data to bet on and an average prospect profile.
Montgomery suffered a groin injury in camp, and could be questionable for the start of the season.
Honorable Mentions
Here are some of the other running backs that did not score touchdowns the way their numbers project that they should have:
| ATD/XTD | Rushing Attempts | XrTD | ArTD | ArTD/XrTD | Receiving Yards | XrcTD | ArcTD | ArcTD/XrcTD | |
|---|---|---|---|---|---|---|---|---|---|
| Frank Gore | 0.29 | 166 | 7 | 2 | 0.29 | 100 | 0 | 0 | 0 |
| Le’Veon Bell | 0.57 | 245 | 4 | 3 | 0.75 | 444 | 3 | 1 | 0.33 |
| Nick Chubb | 0.67 | 298 | 11 | 8 | 0.73 | 278 | 1 | 0 | 0 |
| Alvin Kamara | 0.67 | 171 | 5 | 5 | 1.00 | 533 | 4 | 1 | 0.25 |
| Gus Edwards | 0.40 | 133 | 5 | 2 | 0.40 | 45 | 0 | 0 | 0 |
| Alexander Mattison | 0.25 | 100 | 4 | 1 | 0.25 | 82 | 0 | 0 | 0 |
Check back in next week for the top overperformers of 2019; the running backs whose touchdown numbers aren’t sustainable.
All stats for this article are from fantasydata.com, profootballfocus.com, profootballreference.com, and sharpfootballstats.com.
Photo by David Rosenblum/Icon Sportswire