
Opportunity Knocks
Volume is king. It’s all quite logical. If a player does not get enough offensive snaps, they cannot be targeted and therefore cannot produce receptions, yards, and touchdowns. These statistics, of course, are the lifeblood of your fantasy football team. Whether you are in a standard, PPR, .5 PPR, Superflex or some combination, you need players on your roster that have the opportunity to produce. When it comes to preparing your draft board, a player’s volume within their real football offense is critical to your fake football ability to claim victory.
Turn Up the Volume
A player’s fantasy value can be measured in two parts: volume and efficiency. The majority of this article will focus on volume. Why focus on the volume statistics? It’s because they are more predictable than efficiency statistics year to year. That means we can take a look at how teams and players performed last season to help get a clearer picture of how they may perform this season. Below are the statistics we will utilize for each team and what they can tell us:
- Snaps – Any offensive play.
- Snap Marketshare(MS) – The percentage of total offensive snaps that the receiver was involved in.
- Targets – A pass attempt that is thrown to a specific receiver. Targets are not just a stat, but a skill. To see targets, a receiver must be able to get open and create separation well enough for the quarterback to deliver the ball to him. For this article, we are looking at receivers to commanded no less than 24 targets–the median in the 2018 season.
- Target Marketshare(MS) – The percentage of the total targets that were distributed to a receiver.
- Air Yards – Air yards are how far the ball travels through the air starting at the line of scrimmage and ending at the point of the reception. Air yards include complete and incomplete passes and do not include any yards gained after the catch. It measures the intent of the coach and quarterback on an offensive snap. For more about air yards, check out this article (Air yards Explained) and many others on the topic by Josh Hermsmeyer.
- Air Yards Marketshare(MS) – The percentage of total air yards a receiver is responsible for.
- 10 & In Targets – A pass attempt that is thrown to a receiver within the opponents 10-yard line. The most valuable part of the red zone.
- 10 & In Marketshare(MS) – Percentage of total targets within the opponents 10-yard line that a receiver is responsible.
We will also be looking at the 10 & In statistics through the lens of how frequently a target resulted in a touchdown. Since snaps from this area of the field are the most valuable, it is important to target players that cash in the most.
Kansas City Chiefs
| KC | League Highest | League Average | League Lowest | |
| Total Plays | 996 | 1135 | 1007 | 878 |
| Plays/G | 62.3 | 70.9 | 62.3 | 54.9 |
| Passing % | 61% | 68% | 59% | 47% |
| Rushing % | 39% | 47% | 41% | 32% |
Looking at the raw numbers, the offense ran just 996 plays in 2018 which is bottom 10 in the league. We obviously know that efficiency won out here as the Chiefs led the league in yards (6819), yards per offensive play (6.8), points for (565), and points per drive (3.12). Needless to say, they were good.
| KC | League Highest | League Average | League Lowest | |
| Neg. G.S. Total Plays | 237 | 624 | 463.1 | 237 |
| % of Plays in Neg. G.S. | 24% | 68% | 46% | 24% |
| Neg. GS.Passing % | 70% | 76% | 66% | 55% |
| Neg. G.S.Rushing % | 30% | 43% | 33% | 18% |
They were so good, in fact, they had the fewest number of plays run when trailing an opponent. Kansas City finished above the league average in passing plays run, but when they got into a negative game script they threw 70% of the time. With touchdown regression being a real possibility for QB Patrick Mahomes, the Chiefs may increase the number of plays from which they are playing from behind. If that is the case, you want a piece of this offense on your fantasy team. The question then becomes which receiving target will get you the biggest portion of the Kansas City Chiefs pie?
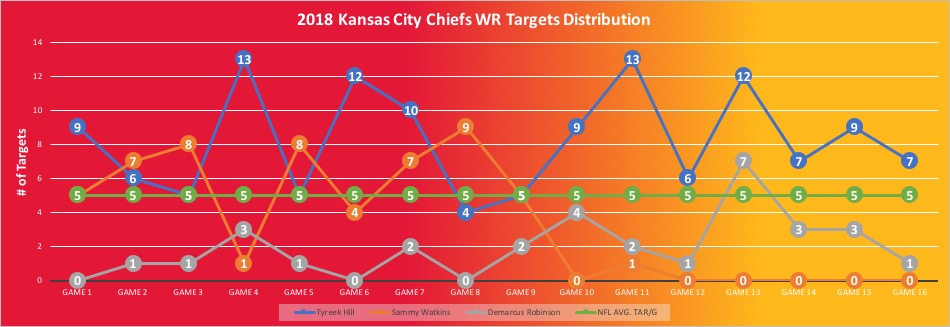
Looking from a target standpoint, WR Tyreek Hill stands out as the obvious choice. However, he did not lead the team in targets. That honor goes to TE Travis Kelce. Hill’s easily the number one wide receiver with his consistent stream of targets. He fell below the league average per game just once in all of 2018.
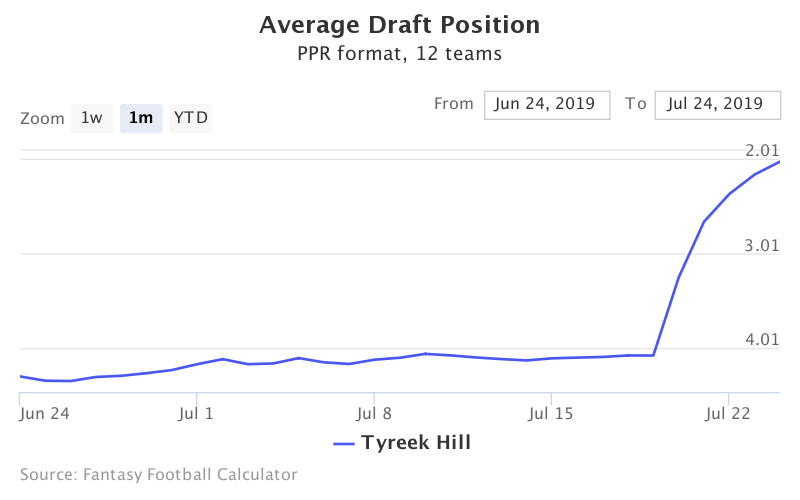
Not only that, but he can take any of those targets to the house. Hill finished in the 98th percentile in yards after catch (520) and in the 91st percentile for average depth of target (14.4). He even accounted for seven end zone targets when within the opponent’s 10-yard line. As of the time of this writing, Hill is currently being drafted at WR6 and 14th overall.
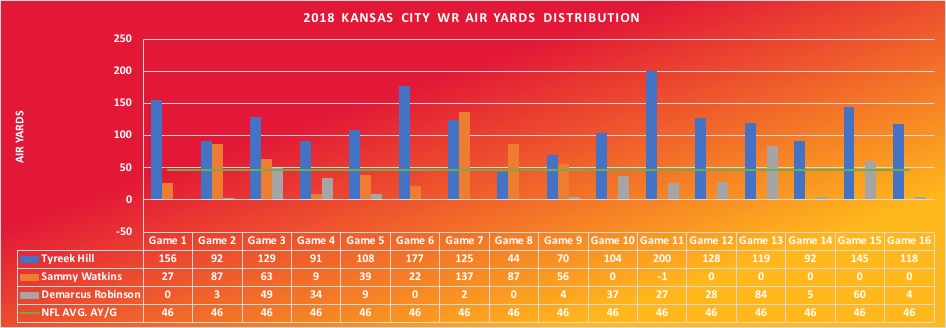
WR Sammy Watkins is someone to consider as well. He has a cheaper price tag, currently going as WR34 in the back end of the 7th round according to fantasyfootballcalculator.com. This price comes with the qualifier “if he can stay healthy.” While healthy, Watkins showed that he was a functional part of the offense, which is something worth investing in when talking about the top offense in the league. His average of 5.5 targets and 52.6 air yards per game (when playing) were not jaw-dropping, but they were usable. If Watkins and/or WR Demarcus Robinson are unable to consistently produce, watch for the explosive rookie WR Mecole Hardman to carve out a spot for himself.
Los Angeles Chargers
| LAC | League Highest | League Average | League Lowest | |
| Total Plays | 945 | 1135 | 1007 | 878 |
| Plays/G | 59.1 | 70.9 | 62.3 | 54.9 |
| Passing % | 58% | 68% | 59% | 47% |
| Rushing % | 42% | 47% | 41% | 32% |
The Los Angeles Chargers played slow last season. They were well below the average in plays per game (59.1), finishing in the bottom five offenses. Despite the slow play, the Chargers tied for third in yards per play (6.3), 11th for total yards (5962), fifth in points per drive (2.4), and sixth in points for (428). This shows that despite the lower end volume, the Chargers were highly efficient.
| LAC | League Highest | League Average | League Lowest | |
| Neg. GS. Total Plays | 382 | 624 | 463.1 | 237 |
| % of Plays in Neg. GS. | 40% | 68% | 46% | 24% |
| Neg. GS.Passing % | 67% | 76% | 66% | 55% |
| Neg. GS.Rushing % | 33% | 43% | 33% | 18% |
The Bolts ranked in the top 10 for the number of plays run from a negative game script (382 plays) and tied for eighth for the percentage of plays run with a negative game script(40%). This means that the Chargers are a good pro football team, but may not be the best place to invest in the passing game. With a below league average passing play percentage and with the team playing in neutral or positive game scripts 60% of the time, this is not the makeup of a high volume passing offense.
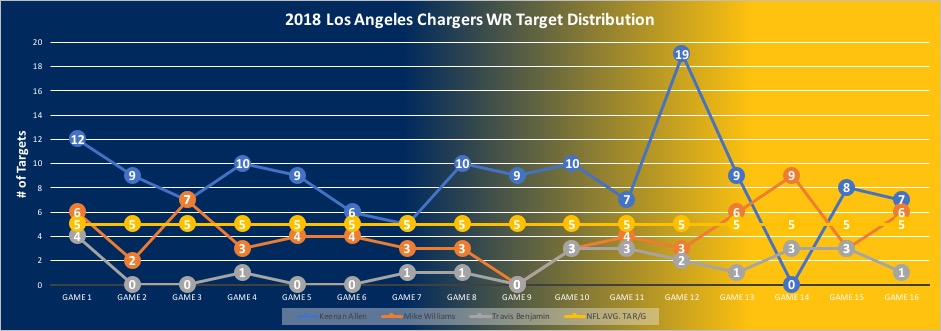
Los Angeles’ top wideout option is WR Keenan Allen. Allen was a target monster, finishing the season with 137 targets. That was good enough for the 98th percentile in targets last season. Allen was healthy and was consistently targeted above the league average of 5 targets per game.
The rest of the receiving corps hovered around the 65 total targets mark. However, with WR Tyrell Williams now in Oakland, that leaves 63 targets to be redistributed between the rest of the receivers. The Chargers can choose between WR Mike Williams, WR Travis Benjamin, returning TE Hunter Henry, or whoever is coming out of the backfield this season. Williams and Henry have the most upside and should benefit the most from the vacated targets. Williams flashed towards the end of the season, especially in the touchdown department.
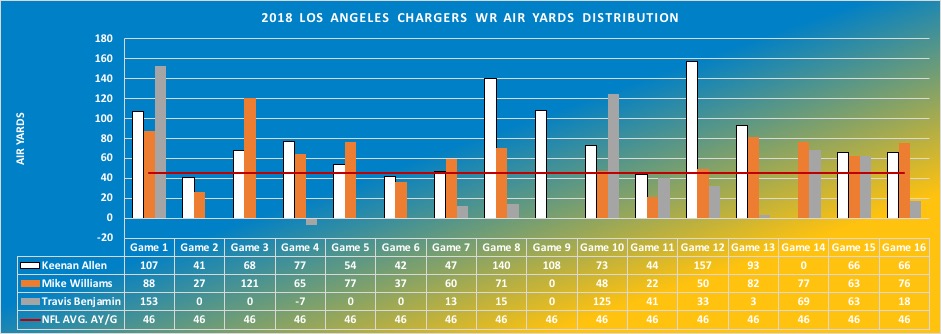
As seen above, Williams was a consistent piece of the Chargers offense. His 60.3 air yards per game total is well above league average and not far behind Keenan Allen’s 73.9 air yards per game. Williams also was big in the most valuable part of the field, receiving nine targets within the opponents 10-yard line. Williams converted those nine targets into six touchdowns.
He finished the year with 10 total touchdowns, but based on his yardage he was only expected to score four times. Expect some regression in the touchdown department, especially with another big-bodied receiver on the field with the return of Henry. Keep an eye on Hunter Henry’s usage because if he doesn’t take a lot of the vacated volume, then it should logically go Williams way. If that were to happen, it may be enough to sustain a similar touchdown total this year.
Denver Broncos
| DEN | League Highest | League Average | League Lowest | |
| Total Plays | 1015 | 1135 | 1007 | 878 |
| Plays/G | 63.4 | 70.9 | 62.3 | 54.9 |
| Passing % | 61% | 68% | 59% | 47% |
| Rushing % | 39% | 47% | 41% | 32% |
When investing fantasy draft capital into a player, it makes more sense to invest in players from a good offense. Good offenses rack up more offensive plays and those snaps produce the fantasy stats you need to dominate your league.
Denver is not a team you think of when you think of dynamic offenses, but their peripheral numbers look promising for the passing game if they can become more efficient. They ran an above-average number of plays (1015) and plays per game (63.4). They were more pass-heavy than the league average which came to me as a surprise because of the Broncos most dangerous fantasy weapon last season: RB Phillip Lindsay.
| DEN | League Highest | League Average | League Lowest | |
| Neg. GS. Total Plays | 624 | 624 | 463.1 | 237 |
| % of Plays in Neg. GS. | 61% | 68% | 46% | 24% |
| Neg. GS.Passing % | 68% | 76% | 66% | 55% |
| Neg. GS.Rushing % | 32% | 43% | 33% | 18% |
One explanation for the high pass play percentage is the fact that Denver ran a league-high 624 plays in a negative game script. They played from behind 61% of the time and that is going to lead to more passing. When playing from behind, they threw the ball 68% of their plays which was second in football behind only the Green Bay Packers.
The big difference is that Green Bay had QB Aaron Rodgers while Denver relied on the arm of QB Case Keenum who averaged only .37 points per dropback (third-worst in the league.) Unfortunately, of the 3 quarterbacks ahead of him (two are tied with .36 points per dropback), one of them is new Broncos QB, Joe Flacco.
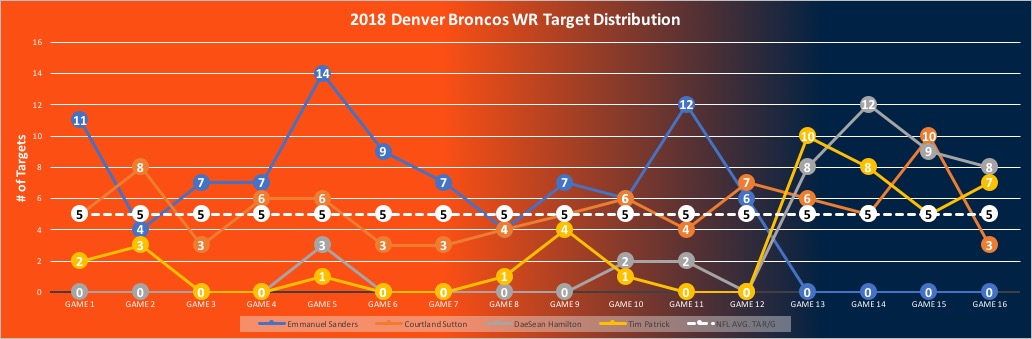
Hopefully Joe Flacco can improve on his numbers from last year because the Broncos have a talented young receiving corps. Before his injury, WR Emmanuel Sanders was the go-to receiver for Denver, but after he went down with an Achilles injury the offense had to look elsewhere. Current second-year WR DaeSean Hamilton (rookie when these stats were accrued) seemed to absorb the majority of Sanders vacated target share.
He is currently being drafted as WR57 or the middle of the 13th round; that’s criminally low. Sanders is currently trending towards starting for the Broncos in Week 1, but he’s now on the back end of his career at 32 years old and coming off an injury that can zap a players explosiveness and ability to create separation. Hamilton is likely to see his fair share of snaps and may work his way into the offense as a permanent fixture.
Another young talent that broke out after Sanders went down was WR Tim Patrick. Over those last four games of the year, Patrick average 7.5 targets and 71.5 air yards per game were a big leap from his previous production. He is a receiver with a good catch radius and speed, finishing in the 88th and 81st percentiles respectively coming out of college according to playerprofiler.com.
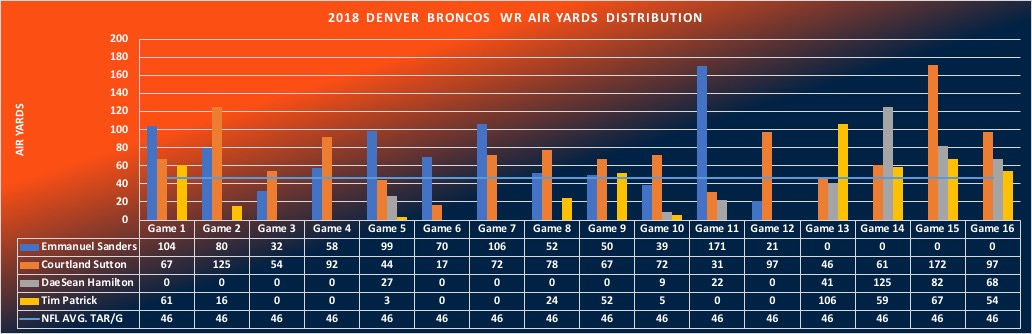
Speaking of catch radius and speed, the Broncos have another talented young receiver that had more consistent opportunity last season: WR Courtland Sutton. Sutton finished the season with 84 targets (second best for Denver wide receivers) but unfortunately only brought in 41 receptions. That is a catch rate of just 49% and leaves much to be desired with the league average at 66%. Some of the cause for the low catch rate can be written off as getting a higher percentage of his targets downfield with a 14 ADoT. If he could have been more efficient, even just league average, he would have had approximately 14 more receptions last season. He’s a player with a high ceiling and a quarterback that historically likes to throw deep to his receivers. This fits Joe Flacco’s strengths well for the coming season.
Oakland Raiders
| OAK | League Highest | League Average | League Lowest | |
| Total Plays | 995 | 1135 | 1007 | 878 |
| Plays/G | 62.2 | 70.9 | 62.3 | 54.9 |
| Passing % | 61% | 68% | 59% | 47% |
| Rushing % | 39% | 47% | 41% | 32% |
Similar to the Broncos, the Oakland Raiders were an average offense when looking at plays and plays per game. The peripherals look decent, however: they rank 28th in the league in both points for (290) and points per drive (1.57) They also ranked towards the bottom (23rd) in total yards (5379) and just as low (22nd) in yards per play.
| OAK | League Highest | League Average | League Lowest | |
| Neg. GS. Total Plays | 563 | 624 | 463.1 | 237 |
| % of Plays in Neg. GS. | 57% | 68% | 46% | 24% |
| Neg. GS.Passing % | 67% | 76% | 66% | 55% |
| Neg. GS.Rushing % | 33% | 43% | 33% | 18% |
Also like Denver, the Raiders spent 563 (57%) of their offensive plays trailing their opponent. This typically opens up the offense to more passing opportunities and the Raiders just about matched the league average in pass and rush percentages when in a negative game script.
The good news for the Raiders is they have a totally revamped receiving corps. The bad news is that this eliminates all but one receiver from the roster last year that had more than the league median of targets. Jon Gruden and Mike Mayock have ruined this Opportunity Report exercise as it was previously done for other AFC and NFC West teams. However, we will look into the past to try and help us better predict what will happen in the future.
Let’s start with Jon Gruden and his coaching tendencies.
| Jon Gruden | 2018 OAK | 2008 TB | 2007 TB | 2006 TB | 2005 TB |
| Offensive Plays | 995 | 1045 | 975 | 972 | 985 |
| Passing Attempts | 556 | 562 | 490 | 535 | 487 |
| QB Sacks | 52 | 32 | 36 | 33 | 41 |
| Rushing Plays | 387 | 451 | 449 | 404 | 457 |
| Passing Play % | 61% | 57% | 54% | 58% | 54% |
| Rushing Play % | 39% | 43% | 46% | 42% | 46% |
Here is an overview of how Gruden’s offenses have functioned over the last five seasons he was a head coach. Last season, he threw the ball more than any time in his previous five coaching years. This also makes sense because the NFL has changed to a more pass-heavy game in the last decade. Here are the five-season averages for Gruden’s offenses.
| Jon Gruden | Historically |
| Offensive Plays | 994.4 |
| Passing Attempts | 526 |
| QB Sacks | 38.8 |
| Rushing Plays | 429.6 |
| Passing Play % | 57% |
| Rushing Play % | 43% |
These numbers are pretty close to the 2018 league average. Now let’s focus on the new receivers coming to Oakland–WR Antonio Brown and WR Tyrell Williams specifically. Looking at the median (since there are some statistics that have a wide range, the median will function as a better midpoint) of their statistics, we can get a pretty good idea of each player’s typical target market share within their offense. It’s also important to look at their ADoT to help project air yards.
| Name | Position | Season | Team | Targets | Air Yards | TD | ADoT | AY MS | Tar MS |
| Antonio Brown | WR | 2018 | PIT | 167 | 1899 | 15 | 11.4 | 0.38 | 0.26 |
| Antonio Brown | WR | 2017 | PIT | 162 | 2176 | 9 | 13.4 | 0.45 | 0.3 |
| Antonio Brown | WR | 2016 | PIT | 154 | 1584 | 12 | 10.3 | 0.33 | 0.28 |
| Antonio Brown | WR | 2015 | PIT | 193 | 2123 | 10 | 11 | 0.36 | 0.33 |
| Antonio Brown | WR | 2014 | PIT | 181 | 1831 | 13 | 10.1 | 0.33 | 0.3 |
| Antonio Brown | WR | 2013 | PIT | 165 | 1785 | 8 | 10.8 | 0.37 | 0.29 |
| Antonio Brown | WR | 2012 | PIT | 106 | 1095 | 5 | 10.3 | 0.27 | 0.23 |
| Median | 165 | 1831 | 10 | 10.8 | 0.36 | 0.29 | |||
| Average | 161.142857 | 1784.71429 | 10.2857143 | 11.0428571 | 0.35571429 | 0.28428571 |
| Name | Position | Season | Team | Targets | Air Yards | TD | ADoT | AY MS | Tar MS |
| Tyrell Williams | WR | 2018 | LAC | 63 | 789 | 5 | 12.5 | 0.21 | 0.13 |
| Tyrell Williams | WR | 2017 | LAC | 69 | 988 | 4 | 14.3 | 0.21 | 0.12 |
| Tyrell Williams | WR | 2016 | SD | 119 | 1382 | 7 | 11.6 | 0.28 | 0.21 |
| Median | 69 | 988 | 5 | 12.5 | 0.21 | 0.13 | |||
| Average | 83.6666667 | 1053 | 5.33333333 | 12.8 | 0.23333333 | 0.15333333 |
Using 2019 team expectations to help get an idea of game script, coach play-calling tendencies, and player historical data, we can very roughly predict a player’s seasonal outcomes. Remember, this is a very rough projection but one that should hopefully put us in the ballpark of these players expectations in a brand new offense.
| Projections | Team | Targets | ADoT | Tar MS | Air Yards | Rec Yards | TD |
| Antonio Brown | OAK | 156 | 11.0 | 28% | 1710.9 | 1351.59 | 9 |
| Tyrell Williams | OAK | 83 | 12.8 | 15% | 1066.5 | 821.22 | 5 |
With the Raiders once again looking to be behind in most of their games this season, look for Antonio Brown to command a lot of volume in the intermediate passing game. Tyrell Williams projects out to have about 20 more targets this year than he averaged with the Chargers over the last two years. Since the negative game script is likely, both of these receivers should be viable fantasy assets this year.
Data used in this article is from airyards.com, profootballreference.com, pff.com, playerprofiler.com