
Opportunity Knocks
Volume is king. It is all quite logical. If a player does not get offensive snaps, they cannot be targeted, and therefore cannot produce receptions, yards, and touchdowns. These statistics, of course, are the lifeblood of your fantasy football team. Whether you are in a standard, PPR, .5 PPR, Superflex or some combination, you need players on your roster that have the opportunity to produce. When it comes to preparing your draft board, a player’s volume within their real football offense is critical to your fake football ability to claim victory.
Turn Up the Volume
A player’s fantasy value can be measured in two parts: volume and efficiency. The majority of this article will focus on volume. Why focus on the volume statistics? It’s because they are more predictable than efficiency statistics year to year. That means, we can take a look at how teams and players performed last season to help get a clearer picture of how they may perform this season. Below are the statistics we will take a look at for each team and what they can tell us:
- Snaps – An offensive play.
- Snap Marketshare(MS) – The percentage of total offensive snaps that the receiver was involved in.
- Targets – A pass attempt that is thrown to a specific receiver. Targets are not just a stat, but a skill. In order to see targets, a receiver must be able to get open and create separation well enough for the quarterback to deliver the ball to him. For the purposes of this article, we are looking at receivers to commanded no less than 24 targets, the median, in the 2018 season.
- Target Marketshare(MS) – The percentage of the total targets that were distributed to a receiver.
- Air Yards – Air yards are how for the ball travels through the air starting at the line of scrimmage and ending at the point of the reception. Air yards include complete and incomplete passes and do not include any yards gained after the catch. It measures the intent of the coach and quarterback on an offensive snap. For more about air yards check out this article, Air yards Explained, and many others on the topic by Josh Hermsmeyer.
- Air Yards Marketshare(MS) – The percentage of total air yards a receiver is responsible for.
- 10 & In Targets – A pass attempt that is thrown to a receiver within the opponents 10-yard line. The most valuable part of the red zone.
- 10 & In Marketshare(MS) – Percentage of total targets within the opponents 10-yard line that a receiver is responsible.
We will also be looking at the 10 & In statistics through the lens of how frequently a target resulted in a touchdown. Since snaps from this area of the field are the most valuable, it is important to target players that cash in the most.
Los Angeles Rams
The Los Angeles Rams ran the fourth-most offensive plays in the NFL last season, with 1060. The Rams would be considered a pass-friendly team with 53.6% (n=568) of those offensive snaps resulting in a pass attempt. This means plenty there is plenty of opportunities to go around in the Rams offense, hence the multiple fantasy viable receivers.
| Games | Snaps | Snaps MS | Targets | Target MS | Air Yards | Air Yard MS | TD | 10 & In Targets | 10 & In MS | 10 & In TD | 10 & In TD MS | |
| Brandin Cooks | 15 | 800 | 91% | 116 | 22% | 1469 | 32% | 5 | 8 | 16% | 2 | 13% |
| Robert Woods | 16 | 854 | 97% | 129 | 23% | 1462 | 30% | 6 | 8 | 16% | 4 | 25% |
| Cooper Kupp | 8 | 439 | 83% | 54 | 20% | 438 | 20% | 6 | 7 | 14% | 2 | 13% |
| Josh Reynolds | 11 | 431 | 49% | 53 | 14% | 657 | 19% | 5 | 5 | 10% | 3 | 19% |
Everyone should be happy drafting either Robert Woods or Brandin Cooks to their squad. The two put up nearly identical seasons last year. Each met or exceeded the league average in targets in every game but one. Cooper Kupp was off to an amazing start before going down with a knee injury mid-season. However, it is evident that as Josh Reynolds was worked into the offense, he was just as effective as the man he was replacing. This wide receiving core is worth your investment!
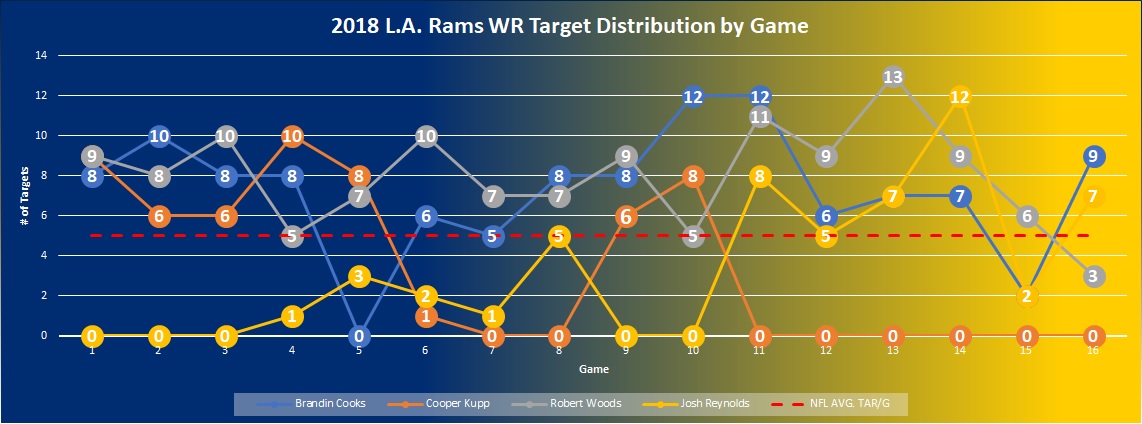
All wide receivers, except Reynolds, averaged more targets per game than the NFL average (5 targets). However, in the last six games when Reynolds took over for Kupp full time, Reynolds averaged the same targets per game as Kupp before his injury. All four receivers maintain consistent volume, most of which above average, meaning you will have many opportunities to score fantasy points.
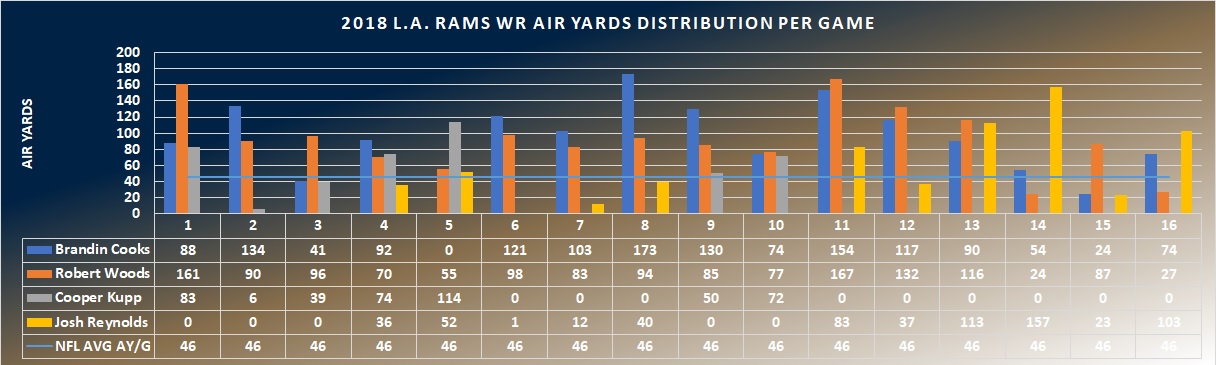
Taking a look at air yards, it is quite evident how much of the offense was being funneled through Josh Reynolds at the end of the year. In fact, Reynolds totaled more than 200 more air yards and averaged more per game. Where Cooper Cupp excels past Reynolds is yards after the catch. Kupp finished in the 89th percentile in yards after the catch. This was still behind Woods (95th percentile) and Cooks (92nd percentile), but lightyears ahead of Reynolds’ 66th percentile mark.
Another differentiator between the wide receivers is their use within their opponents 10-yard line. Both Woods and Cooks had 8 targets within the 10-yard line, but Woods capitalized four times with a touchdown, as opposed to Cooks two TDs. From and 10 & in over the last 3 years receivers with 8 targets would be expected to score 2.95 TD. Although touchdowns rates have the most variance, expect Woods to regress back to around 3 touchdowns and Cooks to maintain or slightly improve over last year’s total.
Seattle Seahawks
The Seattle Seahawks were in the middle of the pack in offensive plays run with 1012 total. It has been well advertised that last year’s team was coached with a run-first mentality. Therefore it is not surprising that Seattle was last in the league in passing on 42.2% of their plays. When searching for places to invest your fantasy football draft capital, you would want to find high volume offenses. Seattle was merely average last season in overall volume and did not funnel much of their offense through the air. As a result, there are only three wide receivers, one of which is being grossly undervalued.
| Team | Games Stats Accrued | Snaps | Snap MS | Targets | Tar MS | Air Yards | AY MS | TD | 10 & In Tar | 10 & In MS | 10 & In TD | 10 & In TD MS | |
| Tyler Lockett | SEA | 16 | 719 | 84% | 67 | 16% | 910 | 24% | 10 | 3.00 | 9% | 1 | 9% |
| David Moore | SEA | 14 | 468 | 55% | 52 | 15% | 907 | 29% | 5 | 4.00 | 12% | 1 | 9% |
| Vacated | |||||||||||||
| Doug Baldwin | SEA | 13 | 528 | 81% | 69 | 20% | 809 | 26% | 5 | 9.00 | 27% | 3 | 27% |
| Brandon Marshall | SEA | 6 | 191 | 43% | 24 | 15% | 263 | 18% | 1 | 1.00 | 3% | 0 | 0% |
With the retirement of Doug Baldwin and the releasing of Brandon Marshall last season, this year’s Seahawks will have 35% of last season’s targets vacated. That’s a lot of opportunities, however, it would be more exciting if it were on a more pass friendly offense. Looking at Tyler Lockett and David Moore side-by-side, they have very similar volume numbers, although Moore has far fewer snaps. Lockett is currently being drafted as WR23 according to fantasyfootballcalculator.com and Moore is currently undrafted, or free. Should that efficiency improve, he could be a low-end WR2 or WR3 this season and worth a late-round flier even if rookie D.K. Metcalf absorbs the majority of Marshall’s and Baldwin’s vacated volume.
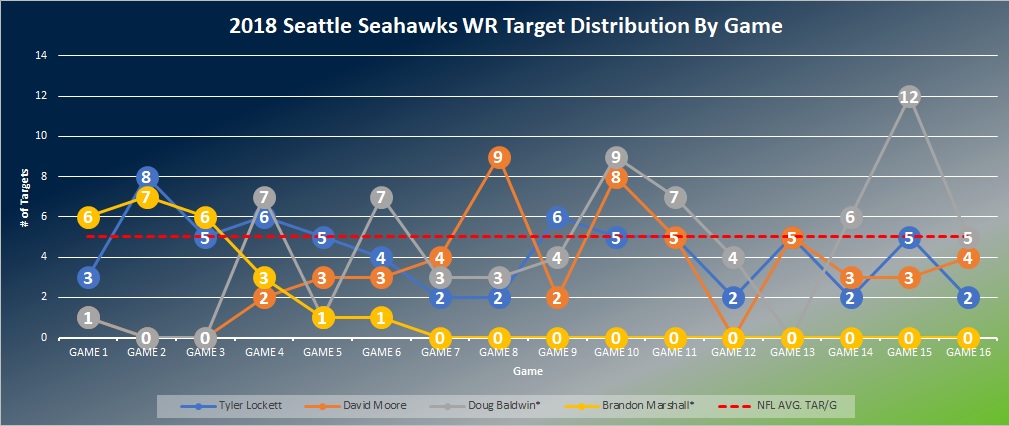
Taking a closer look at how the targets were distributed on a week-to-week basis, it shows why Seattle was last in the league in committing to the pass. No player, with the 24 target minimum in, Seattle averaged above the 5 targets per game league average. Baldwin and Lockett were closest with 4.3 and 4.2 targets per game respectively.
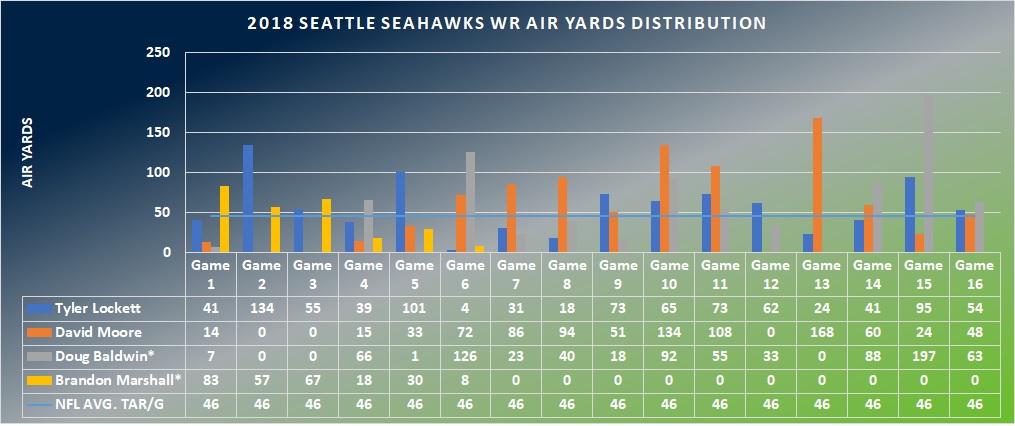
A closer look at air yards shows how David Moore dominated the middle of the season after getting more playing time when Brandon Marshall was cut. Unfortunately, Moore had a below-average catch percentage with just 48% of his targets turning into a reception. Some of this could be explained by his deep average depth of target (ADoT) which was 16.88 yards according to profootballfocus.co. As a result, his catch percentage is lower because it is more difficult to complete deeper passes. It truly pales in comparison to Tyler Lockett’s ridiculous 82% catch percentage with a comparable 14.48 ADot. Both should regress back towards the mean this season in catch percentage.
All receivers were met their expected touchdown rate when receiving targets from inside the 10-yard line. The reason Tyler Lockett finished as WR 16 last season is because of his touchdown rate from outside the 10. Lockett finished the year with a total of 10 touchdowns. A receiver his yardage totals would typically score about 4 touchdowns. That’s a difference of 6 TDs or 36 fantasy points, which would have made Lockett WR24. Prepare for touchdown regression with Lockett.
San Francisco 49ers
San Francisco finished in the bottom half of the league in offensive snaps totaling just 1003. However, they moved the ball through the air by passing on 53% of their plays. When starting quarterback Jimmy Garoppolo was knocked out for the year, the 49ers were forced to move the ball with short passes to the running backs and to target monster George Kittle. Now with Garoppolo back under center, this offense may look a little different this September.
| Team | Games Stats Accrued | Snaps | Snap MS | Targets | Target MS | Air Yards | AY MS | TD | 10 & In Tar | 10 & In MS | 10 & In TD | 10 & In TD MS | |
| Kendrick Bourne | SF | 16 | 449 | 51% | 64 | 12% | 541 | 15% | 4 | 6.00 | 20% | 4 | 40% |
| Dante Pettis | SF | 9 | 378 | 57% | 45 | 12% | 514 | 19% | 5 | 1.00 | 3% | 1 | 10% |
| Marquise Goodwin | SF | 11 | 392 | 68% | 41 | 12% | 547 | 21% | 4 | 1.00 | 3% | 0 | 0% |
| Trent Taylor | SF | 13 | 260 | 34% | 40 | 9% | 254 | 8% | 1 | 3.00 | 10% | 1 | 10% |
| Vacated | |||||||||||||
| Pierre Garcon | 8 | 380 | 72% | 46 | 19% | 478 | 27% | 1 | 1.00 | 3% | 0 | 0% |
Looking at the raw opportunity numbers, no one stands out as being dominant or even above average. Dante Pettis had a solid rookie season with 11.4 air yards per target, but will hopefully see more targets within the opponent’s 10-yard line. If anything, Kendrick Bourne surprises with the most targets by a wide receiver. He also received the most looks within the 10-yard line and capitalized by scoring on an impressive 4 touchdowns. Bourne was responsible for 20% of the targets and 40% of the 49ers’ touchdowns within their opponents 10. The touchdowns are due to regress back to the mean. Needless to say, there is room for rookies Deebo Samuel, Jalen Hurd, and veteran Jordan Matthews to carve out a role for themselves.
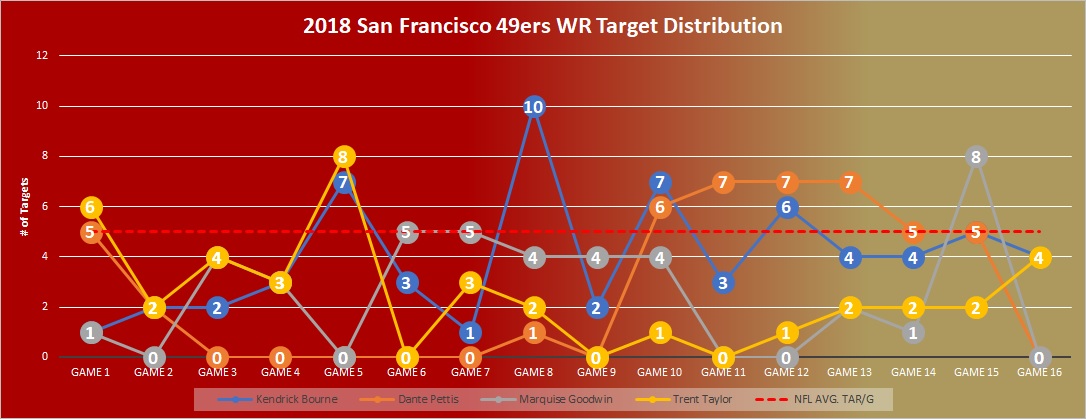
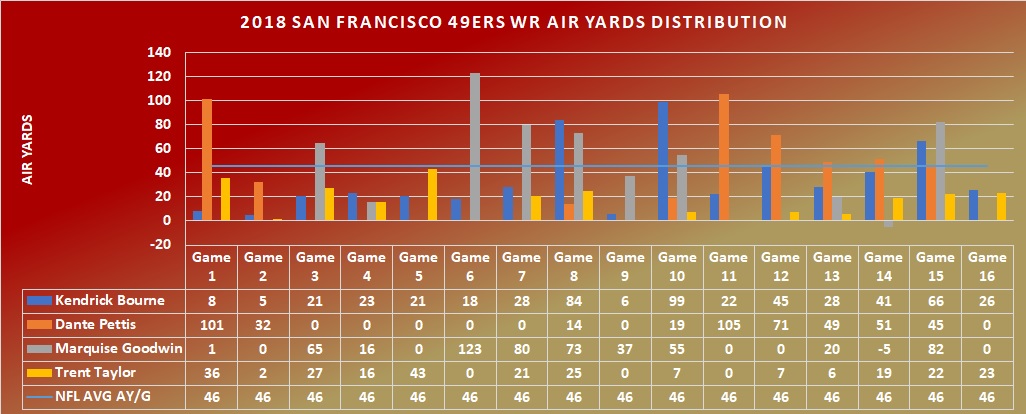
With a closer look at how the season played out, it is clear that Pettis became a fixture in the offense during the final six games. Over that span, he was able to command above the league average of targets per game with an average of 5.3 targets per game. Marquise Goodwin showed flashed at certain points in the season as a guy that San Francisco wanted to get the ball to when he’s healthy. He has game-breaking speed and finished with a team-high 14.34 ADoT. Over the stretch of game 6 through 10, Goodwin was well above league average while averaging 73.6 air yards per game. With more stable quarterback play Goodwin may be in for a better year and is currently being drafted at WR61 according to fantasyfootballcalculator.com.
Arizona Cardinals
The Arizona Cardinals ran the second to least amount of offensive plays in the league last year with 902. Only the Miami Dolphins had fewer. However, of those 902 plays, 54.9% (n=495) were passing attempts. After completing a season most fans would just as soon forget, the organization fired head coach Steve Wilks and started fresh with innovative offensive coach Kliff Kingsbury. Last year, Kingsbury’s Texas Tech air-raid style offense ranked 35 in Adjusted Pace and 23rd in FootballOutsiders Offensive S&P+ metrics. Looking at last season and the players that were able to produce under dire circumstance may help us forecast who may breakout in the new offense.
| Team | Games Stats Accrued | Snaps | Snap MS | Targets | Tar MS | Air Yards | AY MS | TD | 10 & In Tar | 10 & In MS | 10 & In TD | 10 & In TD MS | |
| Larry Fitzgerald | ARZ | 16 | 689 | 91% | 110 | 22% | 1024 | 26% | 6 | 6 | 24% | 2 | 22% |
| Christian Kirk | ARZ | 12 | 542 | 79% | 68 | 19% | 653 | 24% | 3 | 2 | 8% | 1 | 11% |
| Chad Williams | ARZ | 10 | 350 | 78% | 46 | 15% | 567 | 22% | 1 | 2 | 8% | 0 | 0% |
First glance shows that the ageless Larry Fitzgerald had a good season. He was in the 95th percentile in targets when compared to other wide receivers in the league. Fitzgerald was the focal point of the passing offense as evidenced by his 1024 air yards and 6 targets within the 10-yard line. When healthy, Christian Kirk also showed flashes, besting Fitzgerald in air yards per target.
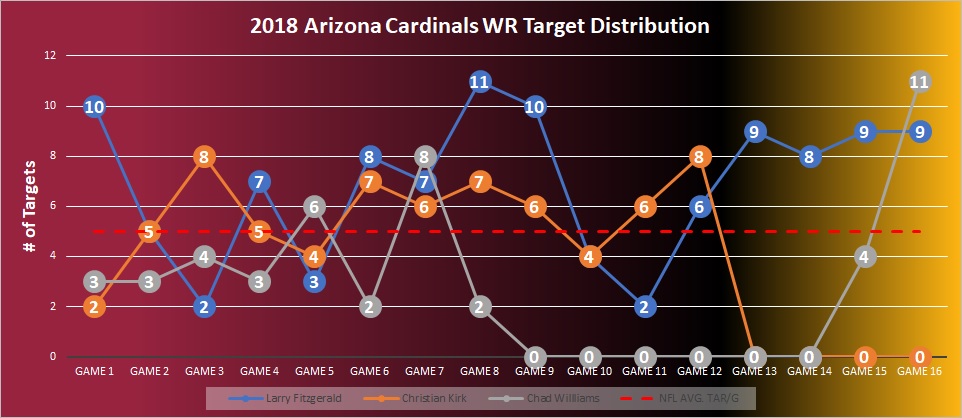
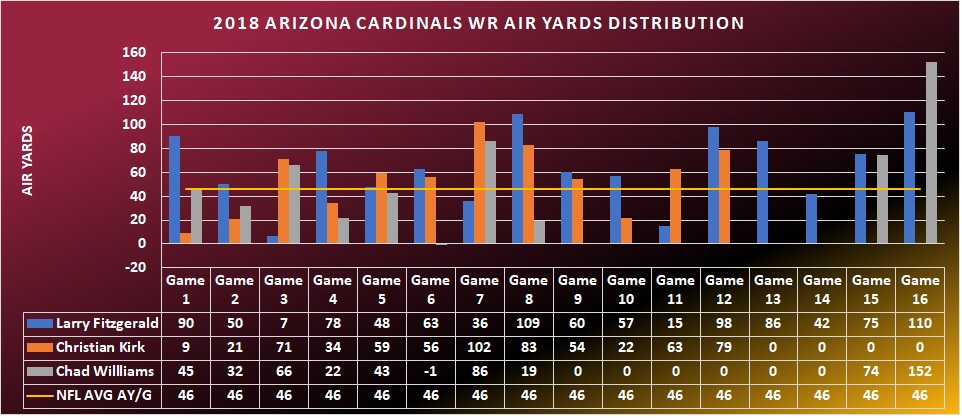
Only Larry Fitzgerald was able to consistently best the NFL average for targets per game with his 6.9 targets per game. However, in the stretch between games 2-12, Kirk was able to tally up an average of 6 targets per game. Over the course of the year, Kirk had a lower range of outcomes in both targets and air yards which may help lead to a more consistent output. Both Fitzgerald and Kirk had similar floors, but Fitzgerald had a higher ceiling last season. When considering age, however, don’t expect that trend to continue into the upcoming seasons as Kirk should supplant Fitzgerald as the WR1 in the offense.
Statistics provided by airyards.com, pro-football-reference.com, and pff.com
(Photo by Chris Williams/Icon Sportswire)