
Turn Up the Volume
A player’s fantasy value can be measured in two parts: volume and efficiency. The majority of this article will focus on volume. Why focus on the volume statistics? It’s because they are more predictable than efficiency statistics year to year. That means we can take a look at how teams and players performed last season to help get a clearer picture of how they may perform this season. Below are the statistics we will utilize for each team and what they can tell us:
- Snaps – Any offensive play.
- Snap Marketshare(MS) – The percentage of total offensive snaps that the receiver was involved in.
- Targets – A pass attempt that is thrown to a specific receiver. Targets are not just a stat, but a skill. To see targets, a receiver must be able to get open and create separation well enough for the quarterback to deliver the ball to him. For this article, we are looking at receivers to commanded no less than 24 targets–the median in the 2018 season.
- Target Marketshare(MS) – The percentage of the total targets that were distributed to a receiver.
- Air Yards – Air yards are how far the ball travels through the air starting at the line of scrimmage and ending at the point of the reception. Air yards include complete and incomplete passes and do not include any yards gained after the catch. It measures the intent of the coach and quarterback on an offensive snap. For more about air yards, check out this article (Air yards Explained) and many others on the topic by Josh Hermsmeyer.
- Air Yards Marketshare(MS) – The percentage of total air yards a receiver is responsible for.
- 10 & In Targets – A pass attempt that is thrown to a receiver within the opponents 10-yard line. The most valuable part of the red zone.
- 10 & In Marketshare(MS) – Percentage of total targets within the opponents 10-yard line that a receiver is responsible.
We will also be looking at the 10 & In statistics through the lens of how frequently a target resulted in a touchdown. Since snaps from this area of the field are the most valuable, it is important to target players that cash in the most.
New Orleans Saints
The Saints are not the high-flying offense they once were. New Orleans was 17th in the league in the number of offensive plays run(1010). Of those plays, they ran just 539 passing plays which put them 29th in the league in passing volume.
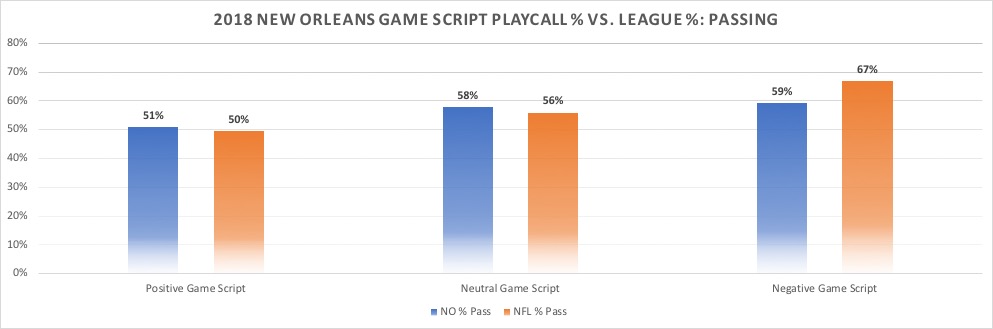
We know that the Saints still prefer passing by looking at their pass to run percentage ratio in a neutral game script. We look at the neutral game script because the team is executing their offense without adapting their playcalling to playing with a lead or trying to catch up. The Saints are still above the league average in calling pass plays with 58% of their plays going through the air. However, when the number of offensive plays run is only average, the Saints don’t have as much passing opportunity as other teams. This means fewer targets to go around.
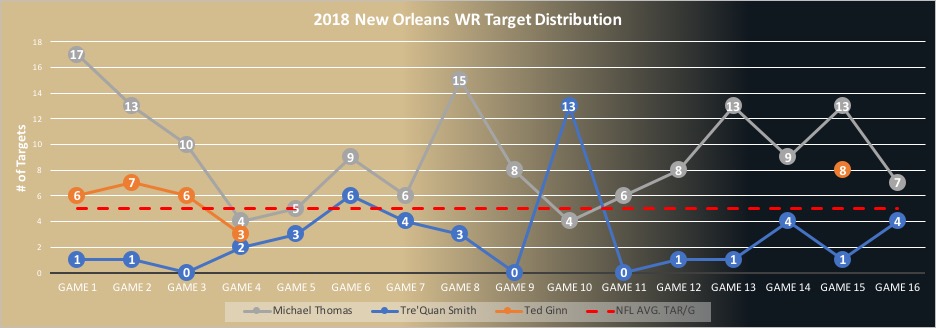
Although there are fewer passing opportunities in New Orleans than most other teams in the league, the target distribution is pretty narrow. Michael Thomas is the man to own in the Saints receiving corps. He owned a whopping 29% of the team’s targets. Although Tre’Quan Smith showed flashes last season, he failed to carve out a consistent role in the offense while Ted Ginn was injured. Brees looked to Ginn more in every game in which the two receivers played.
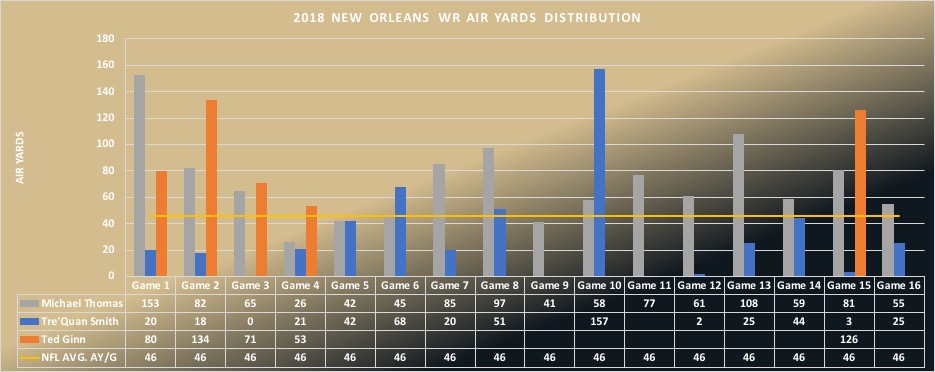
The trend continues when looking at air yards. Air yards can be broken into complete and incomplete categories. The incomplete air yards are just as valuable as the complete because they can measure the intent of the offense. Even though the pass was not completed, they threw the ball to the receiver and he earned a target. Once again, Smith played second fiddle to Ginn when both players were in the same game. Despite one breakout game in Week 11, Smith was barely over the league average in air yards. There are silver linings for Tre’Quan Smith, however, and that is his efficiency. He was much more effective at converting his air yards to receiving yards. This is an efficiency metric created by Josh Hermsmeyer called RACR and it is predictive. Part of this is related to Smith’s catch rate of deep targets (20 or more yards downfield) is much higher than Ginn’s. In this scenario, Smith converted 4 of 9 targets (44.4%) as opposed to Ginn’s conversion of 2 of 11 targets (18.2%).
Summary: Pay for Michael Thomas. He will get a large chunk of the Saints passing offense. Ted Ginn was the favorite last season, but Tre’Quan Smith was a more efficient receiver especially on passes more than 20 yards downfield. Keep an eye on the target distribution between the two and expect it to flip this year as Smith moves into his second year in the NFL.
Atlanta Falcons
The Falcons ended the 2018 season as a top tier offense when considering passing volume. They ran 659 passing plays which were good for a ranking of fifth in the league.
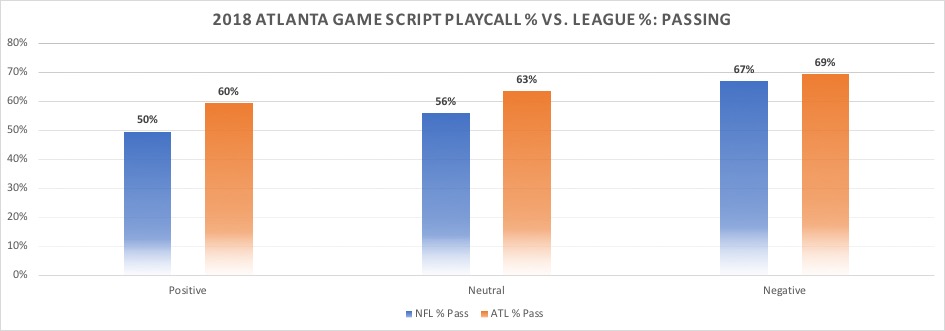
The Falcons let it fly an astounding 65% of the time they ran a play on offense. What’s even more surprising is that they continued to throw even when they were ahead. This is the kind of offensive mindset that you want to invest in when it comes to pass catchers.
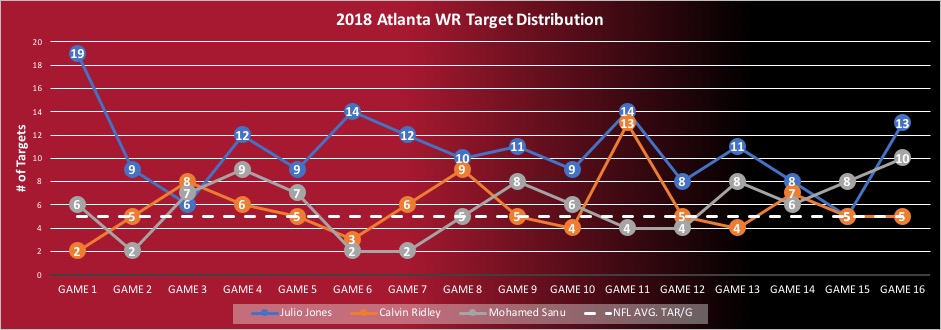
The obvious play is Julio Jones. There were games last year where he was the only major focus in the passing offense. The Falcons could benefit from getting another receiver more involved in the offense ad there were games when Atlanta did. The player that is most likely to take over that mantle is Calvin Ridley. Although statistically, Ridley and Mohamed Sanu had very similar years, Ridley flashed more frequently and scored an unsustainable-at-this-volume-level 10 touchdowns.
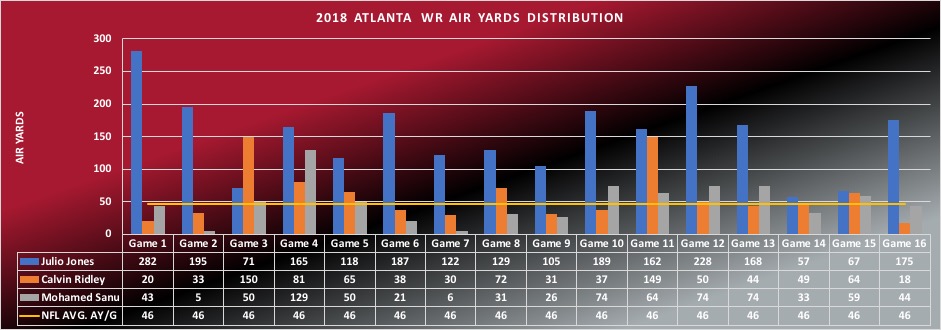
Looking at the Falcons’ air yards distribution the same story bears out. The passing offense runs through Julio Jones and Ridley and Sanu are near equals most weeks. Per Pro Football Focus, Ridley in the more efficient on, the year over year predictive metric, yards per route run (Y/RR). Ridley tallies up 1.77 yards per route versus Sanu’s 1.48 yards per route. He also got more looks inside the opponents 10-yard line which is the most valuable spot to get a target on the field. (All three receivers paled in comparison to Austin Hooper and his 10 targets.) Where Sanu does has Ridley bested is catch percentage and yards after the catch, however, the margins are slim.
Summary- Julio needs to be a top receiver off your board. He finished 2018 in the 100th percentile in both targets and air yards. His opportunity is massive and there is still room to grow with more targets from 10 yards and in from the opponent’s goal line. Ridley has the makings of a solid WR2 in the Altlanta offense and maybe on your fantasy team. He is efficient when given the volume, but don’t expect a repeat touchdown performance unless his opportunities go way up.
Carolina Panthers
The Carolina Panthers are a middle of the pack passing team when it comes to passing volume. Carolina ran 595 passing plays which tied them for 15th in the NFL.
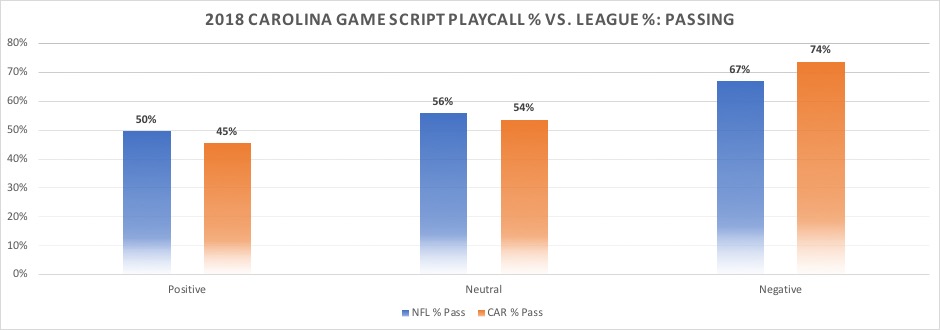
The Panthers equaled the NFL average with 59% of their plays called as passing plays. However, this average is skewed by the amount that Carolina threw the ball in a negative game script. The Panthers threw the ball 74% of the time, which is well above the league average in situations in which they were trailing. In all other game scenarios, Carolina threw the ball less than the league average. This is worth keeping in mind for Panthers receivers in season-long or daily formats. If they are projected to lose, play your Carolina receivers!
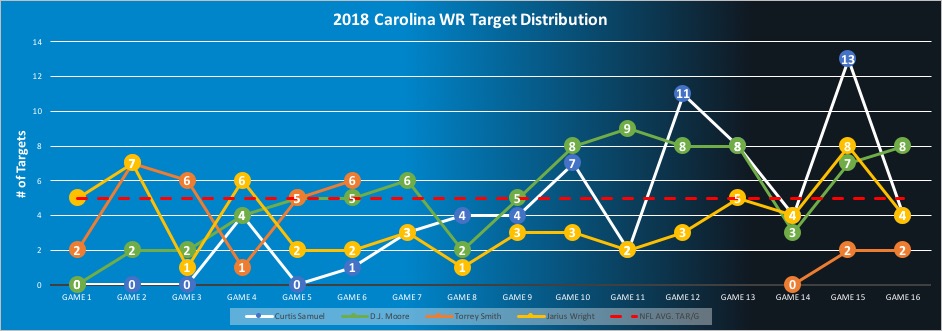
When taking a look at targets, two players are worth rostering, Curtis Samuel and D.J. Moore. Both receivers came on strong starting Week 11 (Game 10), although Moore received more consistent targets. Samuel had more targets from 10 & In with five, while Moore was targeted three times. It is also worth noting that Cutis Samuel accrued his receiving stats (having at least one target in a game) in just 12 games while Moore had more opportunities by accruing targets in 15 games.
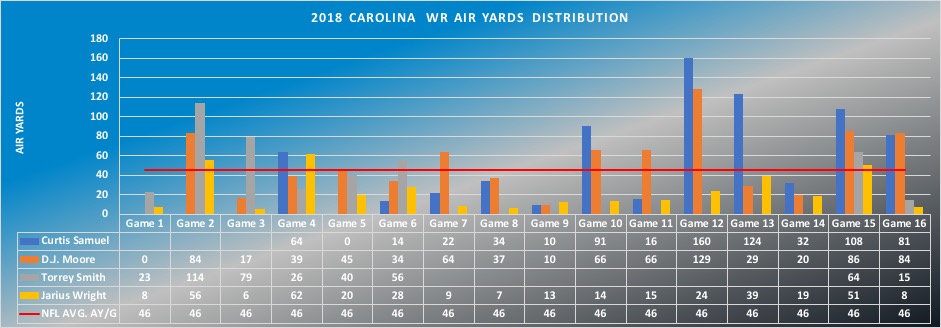
When looking at the intent of the offense through air yards, Curtis Samuel shines. He was the receiver they wanted to get the ball to starting Week 11 (Game 10) through the end of the year. Over that stretch of games, Samuel averaged 87.4 air yards per game for a total of 612 air yards. Moore averaged 68.6 air yards per game in the same stretch for a total of 480 air yards. When looking from an efficiency standpoint, Moore was the better receiver. He posted a RACR of .97 compared to Samuel’s .63. Moore also bested Samuel in yards per route run, with 1.81 Y/RR to 1.66 Y/RR.
Summary: On paper, Curtis Samuel and D.J. Moore are very similar receivers. Samuel got more of the volume while Moore was more efficient last season. Volume is more predictive than efficiency, so if one thing were more likely to occur again, it would be the market share of the offense that Samuel commanded. If volume were equal or near, Moore should be the receiver with the better numbers, but with how close they are, take the cheaper option which at the time of this writing is Curtis Samuel.
Tampa Bay Buccaneers
Tampa Bay was pass-happy in 2018. They finished sixth in the league in plays offensive run with 1055. They, in turn, finished third in the league in passing volume with 666 passing plays run. This is good for over 40 passing plays a game and a recipe for fantasy success.
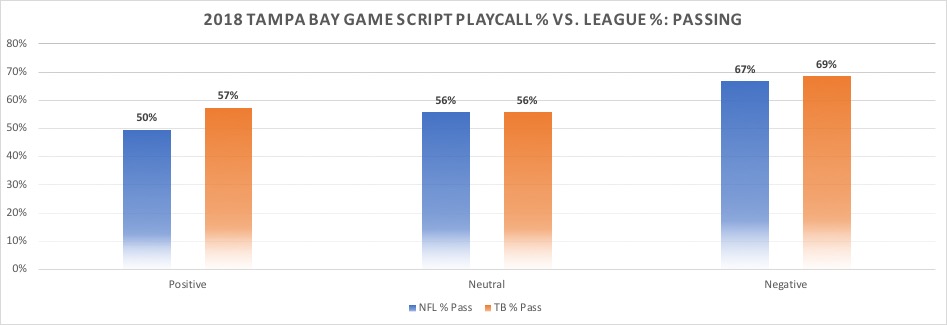
The majority of their passing plays came while the team was trailing (388), but the Bucs threw the ball quite a bit while in the lead. They called a passing play on 57% of their plays while in a positive game script. This trailed only the Packers and divisional foe, Atlanta Falcons.

When looking at the receivers that are returning this season, both are desirable fantasy targets. Mike Evans was healthy and received 22% of the team’s targets. His 135 total targets put him in the 97th percentile in that category for 2018. Not to be outdone is 2019 fantasy darling, Chris Godwin. He received 19% of the team’s targets and finished in the 92nd percentile for 2018 with his 95 targets. Godwin was also a favorite receiving target at the opponent’s 10-yard line and in. He had a market share of 29% of the targets from this point of the field with 11. He was able to convert four of those targets into touchdowns.
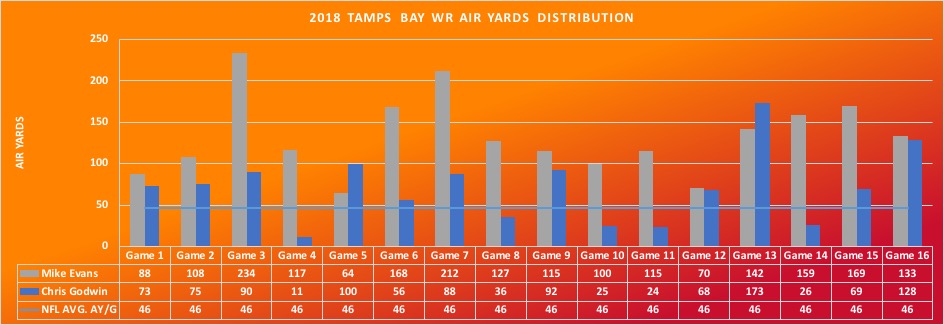
Looking at the air yards paints a similar picture. Mike Evans dominated looks in the passing game. He finished the season with 2121 air yards on the season second to only Julio Jones. He also has a lot of opportunity in the deep passing game with 23.7% of his targets traveling 20 or more yards downfield. Godwin averaged 70.9 air yards per game for a total of 1134. Both receivers make the most of their volume as well. Evans averaged 2.39 YD/RR while Godwin averaged 1.87 Y/RR.
Summary: Mike Evans needs to be considered as a top tier receiver. He is currently going as WR8 in an offense that should lose much, if any, of its pass-first mentality. Chris Godwin stands to be more fantasy relevant in 2019 with the vacated targets of DeSean Jackson and Adam Humphries. With his continued use at 10 & In on the field and even a slight uptick in targets, Godwin could be in line for a top-12 wide receiver season.
(Photo by Cliff Welch/Icon Sportswire)