
Photo by Steven King/Icon Sportswire
The wide receiver position is fairly deep compared to tight end and running back. Consequently, it is often much easier to find serviceable WRs on the waiver wire or in DFS. The rub is that increased options leads to increased confusion of which players to choose. It can be difficult to evaluate the value of 2nd and 3rd receivers from all 32 teams. Most of us have experienced the frustration of having to choose between 2-3 WR options only to watch as the WRs left on our bench outperform the starters. This week I am looking at the usage of WRs with at least 15 targets through week 5 in order to help identify potential value picks.
Modeling Receiver Usage With aDOT and %target share
To get a sense of how each receiver is being used, we can take a look at average depth of target (aDOT) and percentage of target shares (% target shares). If you’re not familiar with the analysis, please take a look at my past articles for a more in-depth explanation.
Briefly,
If we graph %targets by aDOT we can get a sense of how each player is used. We can also look at how this usage compares to league average and break each player into four categories…..
- High %target and high aDOT: elite usage; highest consistent fantasy potential
- High %target and low aDOT: short yardage/checkdown safety net; high fantasy floor (especially in PPR leagues)
- Low %target and high aDOT: selective big-play threat; high ceiling but not targeted consistently (boom or bust candidate)
- Low %target and low aDOT: no consistent usage; least likely to meaningfully contribute
In graph form, it would look like this…..

Usage is Only One Component of Overall Fantasy Success!
Before looking at the data, I want to quickly re-emphasis that the above chart is only examining how a player is being used by his team. It does not account for what a player does with that opportunity. Last week when examining tight ends the data suggested that Ricky Seals-Jones was being used at an Elite level. In week 5, he again received a high percentage of targets and an extremely high aDOT. However, he also scored 0 total points…..because he caught 0 of his targets. We are attempting to use the data to identify potential overrated or underrated players based on usage, but it does not guarantee success. ELITE USAGE DOES NOT MEAN THE PLAYER WILL BE ELITE.
2018 WR Usage Through Week 5
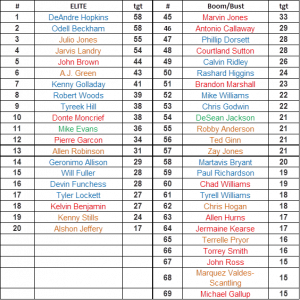
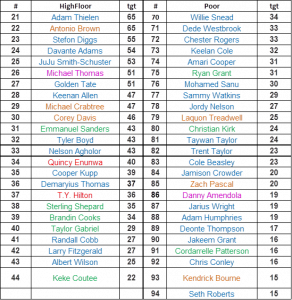
Let’s take a look at our results. The graph below shows all WRs with at least 15 targets while the tables list all players in a given category (numbers do not convey value, just reference between graph and table).

This week I have added two additional pieces of data to the tables to help give more depth to the analysis.
- In each category, players are ranked by overall targets for the year. % target share is great for giving insight into how a team is using a given player. However, some teams pass more than others, so an equal target share does not mean equal opportunity. Total targets combined with %target share helps to give even more insight into player value. **injuries are not accounted for in this analysis, so please use common sense when evaluating players. (for example, Alshon Jeffery is lower on the list due to being out for multiple games, so his %target share is more valuable at this point in the season)
- As discussed above, it is important to consider what a player does with the target opportunities they are given. I have color coded players based on catch % as a better indication of overall value. As expected, players with higher aDOT are more likely to have lower catch % owing to the difficulty of longer pass attempts. As with total targets, players with good catch% have increased value over what simple usage demonstrates. Michael Thomas is a great example of this as his usage is in the high floor category but his catch % is at 90%! That clearly makes him one of the best WRs.
- Color categories
- Elite
- Significantly above average
- Above average
- Below average
- Significantly below average
A Few Takeaways from the Data
- DeAndre Hopkins, Odell Beckham, and Tyreek Hill are among the league leaders in overall usage and catch %. No surprises. However, Kenny Golladay and Robert Woods are also being used at elite levels, have high overall targets, and high catch rates. In fact, both have great value compared to the other wide receivers on their own team. Golladay has looked like a true #1 this year, while Woods is likely being overshadowed by Cooper Kupp and Brandin Cooks.
- John Brown, Donte Moncrief, Pierre Garcon, and Kelvin Benjamin all have elite opportunity, however, they all have all been limited by poor catch %. This may be reflective of the offensive scheme or coverage they are facing. Certainly there are similarities in the struggles at QB for all of these teams, which may contribute to the lower catch %.
- There are a number of players that are categorized as high floor but are among the best WR in the game. This includes Adam Thielen, Antonio Brown, Stefon Diggs, Davante Adams, Juju Smith-Schuster, Michael Thomas, Golden Tate, and Keenan Allen. One thing that is common between these players is the high number of overall targets they receive. In fact, they form a mini cluster on the far right side of the graph. Their aDOT is a bit lower than some other WRs, but that is likely due to scheme and their usage in both short and long yardage situations. I think this reveals that very high %target share may be associated with lower overall aDOT. Clearly, all of these players should be considered as elite. In other words, when a players %target share reaches a high enough level, aDOT may not be a good indicator of increased usage. Something I will need to address when thinking about future modeling.
- Did I mention that Michael Thomas has a 90% catch rate? That is good.
- Shorter aDOT should be associated with a higher catch %, and this tends to pan out as those in the high floor category tend to have higher catch rates. However, Quincy Enunwa and T.Y. Hilton both have significantly lower than average catch rates. Their fantasy ceilings are limited unless this changes.
- Keelan Cole and Amari Cooper are among the players that are ranked surprisingly low. I will say that both are borderline in both aDOT and % target, so although they are below average in both categories, they are close enough that a turnaround is realistic.
We are still dealing with a fairly limited sample size and are not addressing opponent defense schemes or other variables like yards after the catch. However, although I only discussed a few trends above, the data can be used to make more informed decisions about who to start on your fantasy or DFS team. As always, trust the numbers, and good luck!