
When deciding which players to start or sit in fantasy football, we often think of the decision and result as a binary “right or wrong.”
In reality, all players have a range of outcomes within which their fantasy performances might fall. Understanding this can help us make better-informed sit/start decisions than simply comparing rankings or projections.
The Weekly Range of Outcomes Tool can visualize and compare the potential fantasy scores of any two players for the upcoming week. Find out which players have safe floors and high ceilings based on consensus projections and continuously updated consistency data.
Accessing The Tool
Simply click this link to open the tool in Google Sheets. Everything you need is right there. The tool may not work correctly on mobile devices.
You may want to make your own copy of the sheet so that you may freely change the players displayed without fighting others. To do so, just navigate to File > Make A Copy and save your own version to your Google Drive. If you do this, you’ll need to return to the main sheet every week to receive the updated projections and consistency weightings.
The Weekly Range of Outcomes Tool
The tool allows you to compare any two players on the same visualization. You can change the players using the dropdown menus or by typing in to the boxes highlighted grey in Row 1. The tool runs off of consensus projections for PPR scoring and the historical scoring variance for each player.
For example, Keenan Allen (in blue) was remarkably consistent in 2021, generally putting up scores close to his average every week. Tyreek Hill (in green) on the other hand was remarkably boom or bust, often scoring very far above or below his average. Therefore, Allen’s range of outcomes is represented by a relatively narrow and steep curve, while Hill’s is shown as a much wider curve.
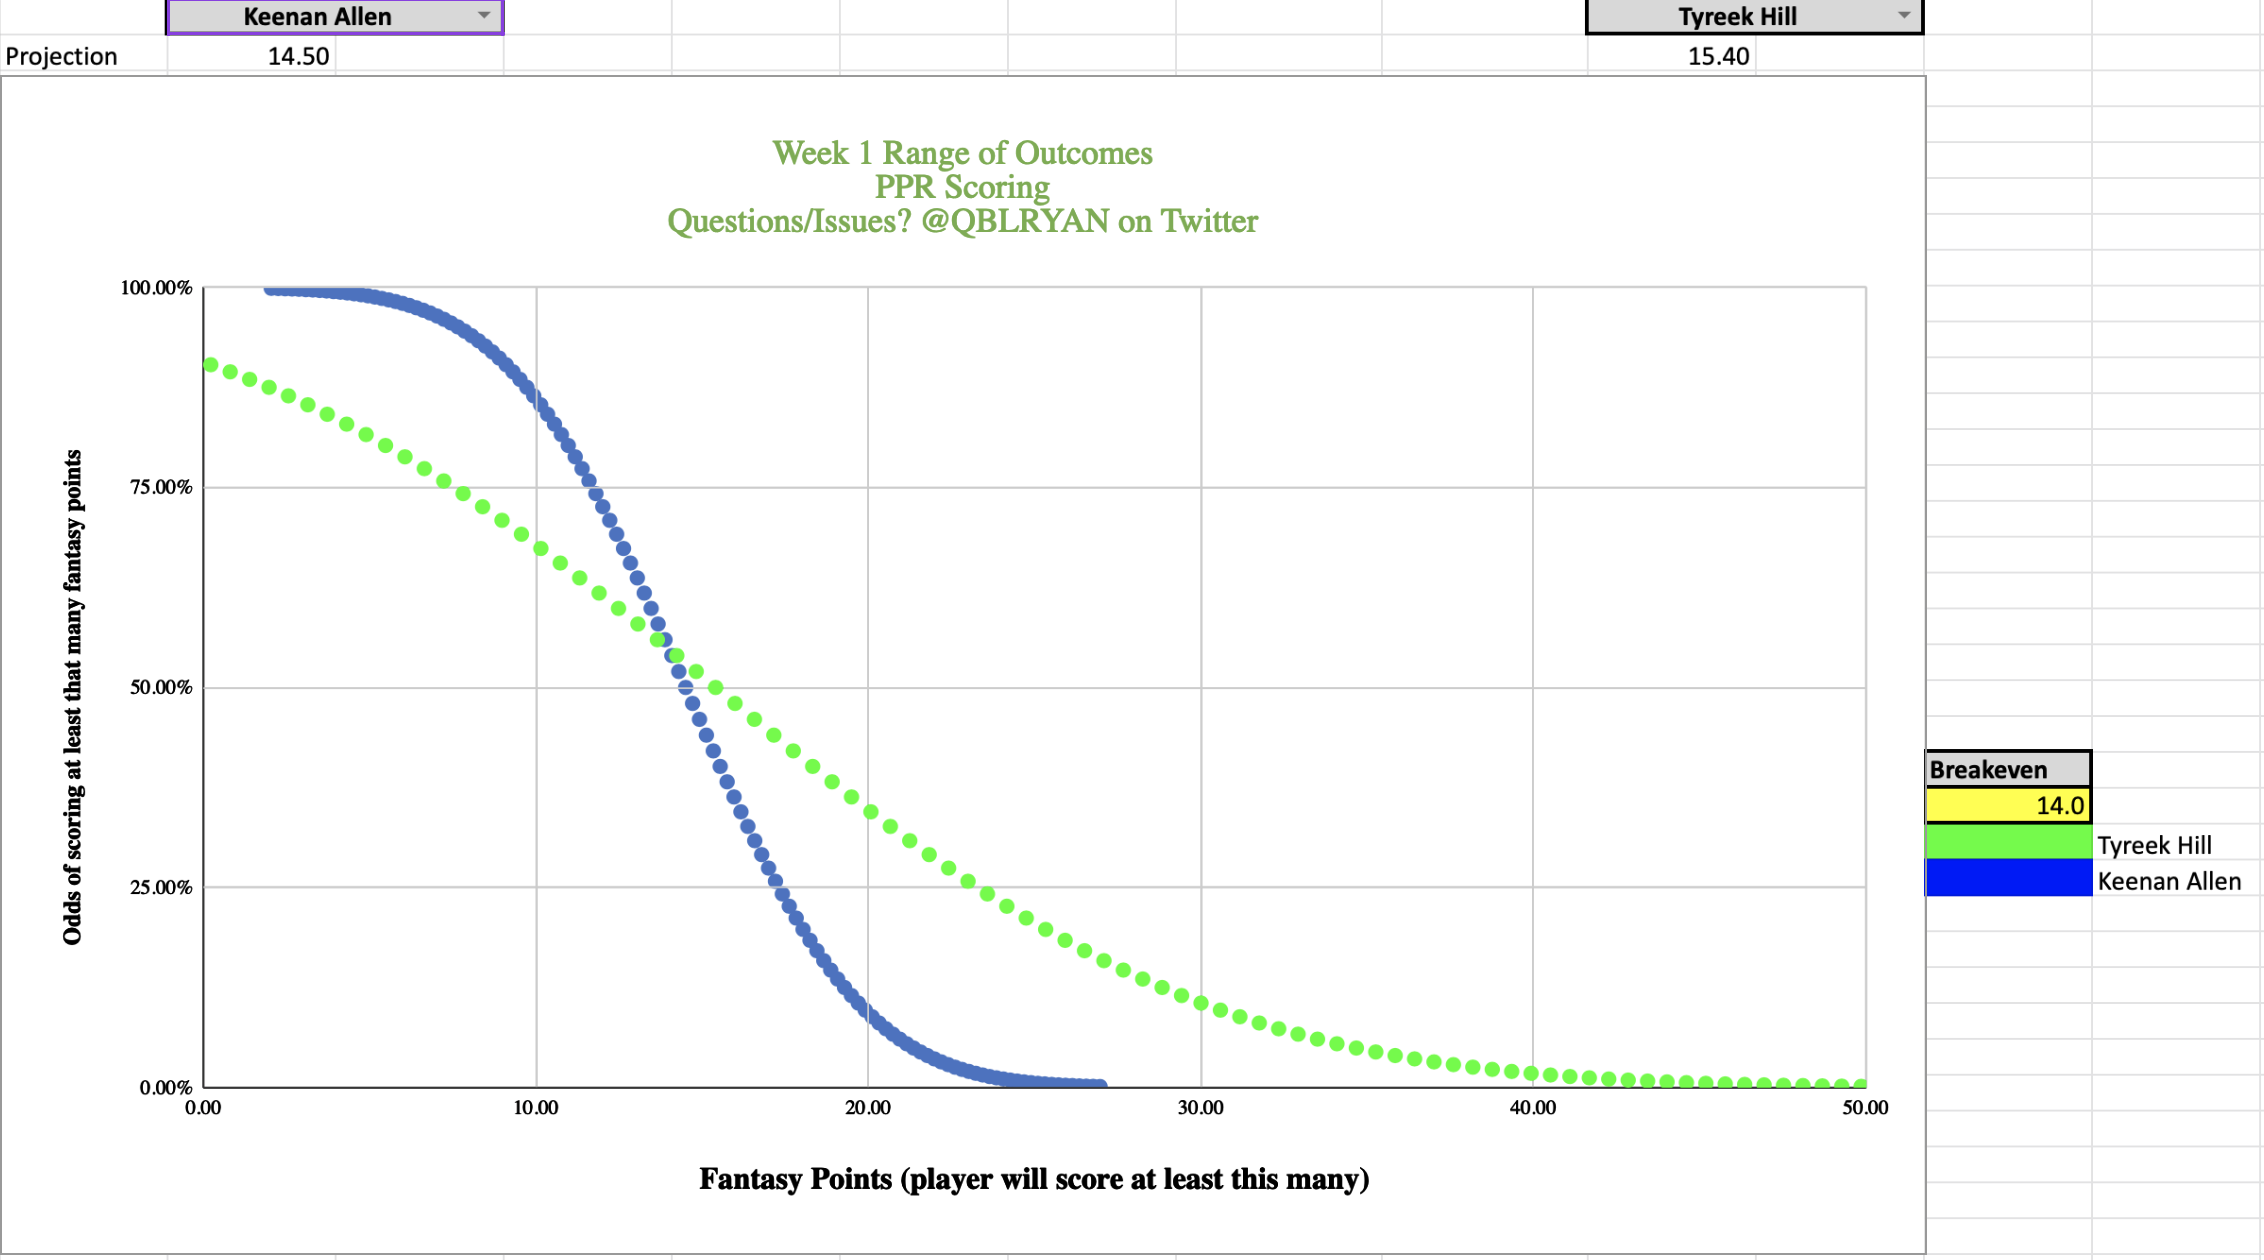
At any point on either line, the x-coordinate (horizontal position) represents a certain number of fantasy points. The y-coordinate (vertical position) represents the percentage chance that the player will score at least that many fantasy points.
In the above example, Keenan Allen’s blue line crosses 75% at about 12 fantasy points, implying he has a 75% chance to score at least 12 fantasy points in the upcoming week. His line crosses 25% at about 17 fantasy points, implying he has a 25% chance of scoring at least 17.
What The Tool Can Tell You
- The percentage likelihood that a player will score a certain number of PPR fantasy points or more.
- Between two players, which of them is the most likely to score at least a certain number of PPR fantasy points
Let’s say you’re rolling into Monday night trailing your opponent by 10 fantasy points, and you have the option of starting Keenan Allen or Tyreek Hill. Simply locate 10 fantasy points on the horizontal axis, then check which player’s line is at a higher likelihood for 10 fantasy points.
At 10 points, Allen’s blue line is higher than Hill’s, showing Allen is the most likely to score 10 or more fantasy points. If that’s all you need, go with Allen. However, at 20 fantasy points, Hill’s green line is considerably higher than Allen’s, showing Hill has a much better chance of going over 20 fantasy points.
This may also be useful for identifying players with weekly blow-up potential in daily fantasy contests, or simply for choosing between high floor and high ceiling players based on the strength of the rest of your starting lineup.
- Which number of fantasy points both players are equally likely to score (where the lines cross)
This is displayed in the highlighted cell labeled “breakeven.” This is simply the number of fantasy points that both players are equally likely to score. If that’s the number you need, the decision is a true toss-up. It is also the point where one player ceases to be the optimal play and the other becomes the optimal play.
If the breakeven number is negative or extremely large, it means one player is optimal over the other regardless of how many fantasy points are needed. In this scenario, the curves would not cross anywhere on the chart.
What The Tool Can’t Tell You
- Where a player sits in my personal weekly rankings/how many fantasy points I would personally project a player for
To find that out, check out our weekly sit/start podcasts, our weekly rankings article, or ask me on Twitter @QBLRyan. Remember, the tool runs off of FantasyPros consensus projections (currently including numberFire, ESPN, and NFL.com) and a systematic formula that I do not adjust to reflect my opinion of specific players (because it would take up my entire week).
- Anything about a scoring format that isn’t PPR
For now, the tool is calibrated based on PPR scoring. It may work “close enough” for .5 PPR formats, though the points would be inflated. We may add additional scoring settings next year. For now, making a copy of the sheet, selecting the two players you want, and inputting their two projections manually in Row 2 will output curves based on the projections you input and a spread based on PPR scoring.
- When a player’s role and consistency has changed
If Ezekiel Elliott were injured, Tony Pollard would step into a completely new role. His median projection that is fed into the tool would change to reflect this, but his previous consistency (what determines the curve’s spread) would not change immediately. The tool is probably going to have a tough time with these types of situations, and may over or understate the ranges for players in new roles.
- What a player will score with any better certainty than what is displayed on the tool’s y-axis
Unlikely outcomes happen all the time in fantasy football. Don’t assume your player is a lock to score near the center of his curve displayed on the tool.
Frequently Asked Questions
Why are projections for kickers and defenses not included?
I’m not very confident that kicker and defense scoring would follow the conventions and assumptions the tool is built on. If enough people want it I may cave.
Why isn’t Player X showing up?
Probably because Player X does not have a projection on FantasyPros. If they do, something is probably broken on my end (maybe he wasn’t in the FantasyPros player pool at the start of the year, for example), which you can feel free to let me know about on Twitter.
How does the tool treat rookies?
At the beginning of the year, each rookie is assigned a level of consistency equal to the average for their position. As the year goes on, all players will have their consistency adjusted to more heavily reflect this year’s results.
Is there actually a 100% chance that Keenan Allen (or any player) will score at least 2 points?
Of course not. Any player can get injured on the first snap they take. I would not take the tool’s outputs at the extremes particularly seriously; of course it is theoretically possible that Keenan Allen could score less than 2 or more than 26 points. I would focus more on the relative likelihoods between two players.
How will I know if you’ve updated the tool for the current week?
I’ll change the label on the chart to reflect the week the tool is showing, as well as a note to the right of the chart indicating the date last updated. It should generally be updated by Wednesday for the following week’s games. I will also tweet out when the tool has been updated from @QBLRyan.