
Photo by Scott Winters/Icon Sportswire
One of the hardest things to do early in a season is to properly evaluate player performance. Small sample size and a poor understanding of the true identities of teams can lead to a lot of misperception. That being said, by using data from previous seasons we can at least make educated guesses about how valuable players will be moving forward. More importantly, we can continuously revisit our evaluations as the season moves forward giving us a much deeper understanding of player value. In particular, week 1 had a lot of surprises at the tight end position. Players like George Kittle, Jared Cook, and Will Dissly looked great while some top picks like Travis Kelce underperformed. Luckily we can use some advanced stats to help make sense of what we saw.
There are 3 main questions I like to ask when evaluating a player’s value. These can be used when thinking about who to pick up on the wire or to decide on who to start in a daily fantasy league.
- How many and what type of opportunities are they getting?
- What are they doing with those opportunities?
- How does their matchup factor into potential?
Today I will focus on the first question.
How many and what type of opportunities are they getting?
The first part of this question, how many opportunities a player is getting, is fairly easy to analyze. The simplest way to evaluate a receiver’s involvement is targets. However, this can be misleading as the total number of touches in a game can vary from team to team and from week to week based on game script. A less variable approach is to evaluate the percentage of a team’s targets (%Target) the player is receiving. If players A and B both get 5 touches, but Team A had double the number of attempts, then player A was less involved in the overall game plan.
The second part of the question, what type of opportunities a player is getting, is more complex. Perhaps the best metric to evaluate this for receivers is average depth of target (aDOT), which describes the average distance the player is being targeted downfield. A low aDOT indicates a tight end is mainly running shallow routes or used as a checkdown receiver, while a high aDOT indicates they are being targeted in the deeper passing game.
If we graph %targets by aDOT we can get a sense of how each player is used. We can also look at how this usage compares to league average and break each player into four categories…..
- High %target and high aDOT: elite usage; highest consistent fantasy potential
- High %target and low aDOT: short yardage/checkdown safety net; high fantasy floor (especially in PPR leagues)
- Low %target and high aDOT: selective big play threat; high ceiling but not targeted consistently (boom or bust candidate)
- Low %target and low aDOT: no consistent usage; least likely to meaningfully contribute
In graph form it would look like this…..

Any prediction model is only useful if it can predict real world truth. So how does our model hold up if we look at 2017 data?

Overall the model is working as expected. Rob Gronkowski, Travis Kelce, Delanie Walker, and Evan Engram are all in the elite usage tier and were all top fantasy TEs in 2017. Zach Ertz and Jimmy Graham both have average aDOT, but were also heavily involved in the red zone (not captured above). Jack Doyle is a prototypical short yardage TE with a high floor due to the high number of targets he receives. David Njoku and Vernon Davis had some big fantasy weeks, but due to a low %targets were not consistent. Of course, this model does not capture the aforementioned red zone targets, number of touchdowns, or yards after catch. That is likely why we don’t see players like Kyle Rudolph or Cameron Brate as a large part of their fantasy success was due to touchdowns.
We can now take a look at data from week 1 2018. Remember, this is a small sample size! We expect a great deal of variability, including higher highs and lower lows, than what we saw over a complete season. Although this may be reflective of week 1 performance, it is impossible to know if it will be indicative of future performance or instead represent an outlier.

Right away our model makes it clear that both George Kittle and Jared Cook had elite usage in week 1. They are likely both due for regression as their numbers were higher than the average of even the best players in 2017. However, the above model does suggest they both could be in for big years. Will Dissly instead appears to be more of a boom or bust candidate. This makes sense given that a large amount of his yards came on a single play. It is also important to note that Travis Kelce’s usage remained in the top tier. Although his performance was not great, I don’t think his owners have anything to worry about. The same is true for Zach Ertz and Jack Doyle: they are used as they always are. On the other hand, Kyle Rudolph was used as a surprisingly small part of the Viking’s game plan. I think this will certainly increase, but like last year, he may be fairly touchdown dependent.
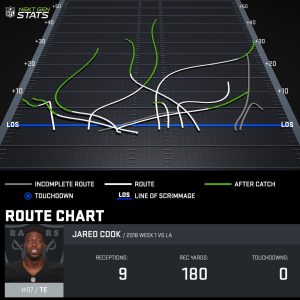
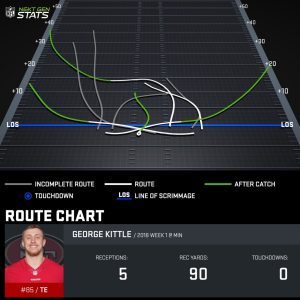
Route diversity can deepen our understanding of TE value
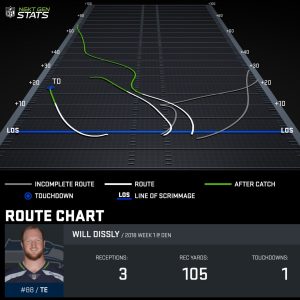
In addition to examining the above metrics, we can further explore how a player fits into an offensive scheme by looking at route diversity. The NFL provides route charts as part of their next gen stats (www.nextgenstats.nfl.com). These are a great visual representation of player usage. As expected given the above data, both Jared Cook and George Kittle ran a diverse array of routes. Jared Cook was particularly used in creative ways, which bodes well for his being a large part of the Oakland offense. Will Dissly’s chart shows a striking difference as he was not only targeted less often but also used in a more limited way. This gives us another layer of data that supports the performances of Cook and Kittle as legitimate while suggesting Dissly may disappoint moving forward.
Context matters: Red Zone targets and TE success
One final note about TE success. As I’ve alluded to earlier, red zone targets and touchdowns are obviously very important for any NFL receiver. More importantly (and unsurprisingly), a higher percentage of team targets in the red zone has a strong positive correlation with overall touchdowns. Last season, Jimmy Graham led all receivers (WR and TE) in %red zone targets; a large reason he had success despite having a fairly average aDOT and %target. The number two receiver? Davante Adams, who is now his teammate. Travis Kelce, Kyle Rudolph, and Zach Ertz also had a high % of red zone targets. We don’t have enough data in 2018 to make any conclusions, but this is something to pay attention to moving forward.
Final thoughts
As the season continues we will be able to better model TE performance. If you were an owner who picked up George Kittle or Jared Cook this week, I think you should feel excited about their future outlook. Of course, that could change quickly if week 1 was simply an outlier.
Player usage is also only one part of the overall performance analysis puzzle. We did not examine what these TEs did with the opportunities they were given. However, I will say that both Kittle and Cook rated very highly in yards after catch per reception, which again speaks to both of their continued success. In contrast, Travis Kelce only caught 1 of his 6 targets, explaining the discrepancy between his elite usage and fantasy production.
Along the same lines, we are not factoring in defensive schemes. It is possible that Jared Cook’s performance was due to the Rams taking away other options. Along the same lines, Zach Ertz was double teamed a great deal in week 1 by Atlanta.
Throughout the season we will continue to update our model and begin to incorporate some of the additional data sets I just mentioned. This should allow us to get an edge in player evaluation. As always, trust the numbers and good luck in week 2.
Great article! Is there a resource where one can access these quadrants charts? This one hits home as the TE position now requires careful consideration with Delanie Walker out on my particular team.