
About once a year, a running back makes fantasy football history.
350 PPR fantasy points in a 16-game season is a stratospheric achievement. When you think of 2016 fantasy football, you think of David Johnson. 2019? All about Christian McCaffrey. Having one of these players on your roster vastly increases your odds of winning your fantasy league, giving you significantly more room for error throughout the rest of your draft. If you need to be convinced of the importance of ceiling in fantasy football, check out Pat Kerrane’s article that inspired this one.
Luckily for us, these players aren’t typically drafted in the first few picks. With an average ADP of 9.0 and examples over the years from throughout the first two rounds, you have a shot at securing this type of player from any draft slot.
If we accept we want to draft for ceiling rather than floor (and, if you’d like to continue winning leagues as the average fantasy football player gets sharper, you should), the next logical question is how to identify these fantasy superstars. If an average of about one running back per year will put up 22+ fantasy points per game, we want to find that player for 2021.
With this goal in mind, I analyzed every season of 350 or more PPR points from the last ten years. That cutoff is admittedly somewhat arbitrary, but with a dozen occurrences in a decade, it feels about right. We’ll talk through the metrics that mattered and the ones that didn’t, then finally, we’ll see if we can apply this knowledge to 2021 drafts.
As an important disclaimer, this article will not claim to tell you with any certainty which player will be a league-winner this year. I’ll only be speaking about a range of outcomes; specifically, a player’s ceiling. Most players will necessarily not reach this ceiling. I will, however, be making statements about the differing likelihoods of certain players reaching these heights. These statements will be supported by the data.
Finally, any players that don’t look amazing as a result of this research aren’t necessarily “total avoids” for me at their ADP. Despite what I suggested earlier, there are certain contexts (like an office league with relatively soft competition) where it may make sense to draft a player for their floor and projected workload. If you’re interested in this approach, be sure to check out a shorter study I did last year about avoiding early-round busts.
With all that out of the way, let’s get started.
Metrics That Matter: Average Draft Position
The first and most foundational measure that will define our consideration set is average draft position (ADP). This is because fantasy gamers are surprisingly good at identifying running backs with elite upside. Check out the ADPs from the week leading up to the season of each of the twelve players who reached 350+ PPR fantasy points:
The first thing you’ll notice is that an early pick helps your odds somewhat, but a later one doesn’t spell doom. As I said, the group’s average was about 9.0, and there are examples on this list selected throughout the first round and even well into the second round.
Le’Veon Bell looks like an outlier here, but just to be safe, we’ll consider every player with an ADP in the first three rounds. ADP can shift as the season approaches and new information is made available, so casting a bit wider of a net than normal here makes sense.
That said, we will be penalizing players who fall one or more standard deviations of ADP away from our mean of 9.0. (Math alert, feel free to skip this paragraph if your eyes just glazed over and you don’t care about the process behind all this.) Standard deviation can be thought of as the typical spread in a dataset that is normally distributed around its mean. This allows us to find the ranges that a hypothetical league-winning running back would likely fall into. ADP for these running backs is likely skewed towards the top and not perfectly normally distributed, but again, we’re being generous to account for potential movement. I’m also aware our sample size is a bit small for this type of statistical analysis, but I felt any data from more than a decade ago would be reflective of a much different NFL, from before the 90%+ opportunity share running back went extinct.
Using a statistical concept called the Empirical Rule, we can determine that most league-winning running backs will be drafted before pick 18, and nearly all of them before pick 27. Therefore, players being drafted after those marks will receive a “knock,” or a mark against them on our scoresheet. Our methodology will be similar for each metric. One knock on a player doesn’t eliminate them; I’m skipping ahead here, but these twelve players averaged just over one knock out of the six metrics we’ll look at.
Back to ADP. “But Ryan! Why does ADP matter? You should be smarter than ADP!” Aside from the old adages about the wisdom of the crowd, ADP can be a good stand-in for projected workload.
You’ll see that a player like D’Andre Swift fits many of the other criteria we’ll discuss, but there’s probably a reason he’s not being drafted until well into the third round. There is a perception that Swift’s workload is under threat this year due to the presence of Jamaal Williams, likely capping Swift’s ceiling. If Williams were to get injured in the preseason, Swift’s ADP would rise, and we would take his potential to go nuclear this year more seriously. For now, as the analysis will show, it’s rather unlikely.
Metrics That Matter: Age
I know this one will be controversial, because it casts doubt on many players currently being drafted in the first round. However, as any dynasty player will tell you, age matters for running backs. This is especially true when searching for players that have 350+ PPR fantasy points in their range of outcomes:
Like it or not, especially in recent years, it has been rare for running backs who are over the age of 25 at the end of the season to deliver the type of production we’re looking for. In accordance with our process from before, we’ll give one knock to any running back who will be 26 or 27 years old on December 31st of this year, and two knocks to any who will be 28 or older.
The running back position is an exceptionally violent one. As players age and injuries pile up, athleticism declines and coaches become less willing to give their players the workloads required for a monumental fantasy season. The decline often comes quickly and without warning, regardless of previous heights. Just take a look at what Todd Gurley has been up to lately.
Metrics That Matter: NFL Draft Capital
I’ll let you in on a secret: the NFL isn’t a perfect meritocracy. Teams will always be trying to prove themselves right and justify decisions they’ve made in previous NFL drafts. Most of the time, the first-round pick will get the first crack over the fourth-round pick, even years after they were drafted.
This applies to the elite tier of fantasy producers as well. It is generally not optimal from an NFL team’s perspective to give a single running back the type of usage they need to put up 350+ fantasy points. Even if the player is capable in all phases of the game, it puts their body in harm’s way and tires them out over time. However, if the team just used a premium draft pick on the player, you’d better believe that management wants them involved more.
You’ll notice that while these mega-producers were drafted throughout the first, second, and third rounds by the NFL, there’s not a single one on the list who was taken on Day 3.
Let me repeat for emphasis: Zero running backs who scored over 350 fantasy points in the last decade were drafted after Day 2 of the NFL Draft.
Perverse incentives on the part of teams aside, draft capital is also a decent barometer for a player’s talent. Players like Aaron Jones and Austin Ekeler can certainly outperform that initial evaluation, but history seems to show they have little chance of reaching the extremely high bar we’ve set.
Accordingly, we’ll give one knock to any player drafted after pick 74, and two to any player drafted later than pick 106.
Metrics That Matter: Speed Score
Here’s another one I feel I’ll have to defend heavily. Created by Bill Barnwell and popularized, as far as I can tell, by PlayerProfiler.com, speed score essentially adjusts a player’s 40-yard dash time to their weight, giving extra credit to players who run faster at heavier weights. PlayerProfiler also makes adjustments for times recorded at pro days and neatly catalogues the speed scores of every player into percentiles.
This metric is surprisingly predictive of running back performance, since it’s a good approximation of how athletic a player is. Straight-line speed isn’t the only thing that matters at the position, but as we’ll discuss, it’s by far the most useful athleticism metric at identifying top fantasy performers. You’ll probably be more convinced if I just show you.
That’s right; our group of 12 players averaged an 82nd-percentile speed score. That means that on average, these players scored better in this metric than 82% of all other players who have run at the NFL Combine or their school’s Pro Day. It turns out that being big and fast is conducive to success for NFL running backs.
Noticeably, not a single running back in the last decade has reached 350+ fantasy points while having lower than a 60th-percentile speed score, and the ones who have been close to that mark really excelled in the other metrics. Unless a player was injured during their run at the Combine, this is a stat to take very seriously.
The math works out so that we’ll be giving a player one knock if they’re at or below the 67th percentile, and two knocks if they’re below the 53rd.
Metrics That Matter: Previous Target Shares
In a PPR format, targets and receptions are incredibly important. In fact, targets are worth 2.37 times more fantasy points than carries. Unsurprisingly, the twelve running backs in our sample averaged over 100 targets and a 19.14% target share in the season they exploded. These target shares often spiked much higher than those the player had previously achieved.
So why do we care about target shares players posted before those seasons? For one, past target shares are all we can know when looking ahead at candidates to break the 350-point barrier in 2021. Additionally, since we’ll be using full-season target shares rather than per-game figures, we can also somewhat capture durability and the coaching staff’s trust in a player. If a running back was heavily targeted all season, they both stayed healthy and were consistently put in the game in passing situations.
You may be skeptical, but take a look at the numbers:
Every single player who reached the pinnacle of fantasy production had achieved at least a 10% target share at some point in their career beforehand. Even Demarco Murray, who crossed the 350 threshold with just 64 targets in 2014, had previously achieved over an 11% target share.
This should cast serious doubt on the odds of players who have not previously reached the 10% target share mark to deliver the type of season we want. We’d better have a very good argument for why their target share could spike to nearly 19% this year.
As such, we’ll be assigning one knock to players who haven’t previously hit a target share of 11.42%, and two knocks to those who haven’t gone over 6.45%.
Metrics That Matter: Team Win Percentage
This final metric probably matters the least of the six, and we also have the least certainty about it. However, it can capture a lot about a player’s situation that we haven’t covered yet, so I felt it was worth including.
To some extent, a team’s win percentage will reflect the overall efficiency of their offense, including the play of the quarterback and offensive line. It will also reflect how favorable of a game script the offense was put in by the defense, leading to more carries for the running back.
You can probably see where I’m going with this. While we don’t have very reliable projections for a team’s 2021 offensive line play or defensive efficiency, we do have access to projected Vegas win totals for the year. These aren’t perfect either, but they’re likely to be a lot more accurate than your favorite analyst’s preseason offensive line rankings.
Here are the actual winning percentages for the teams of each player in our sample:
As you can see, most of these teams did pretty well, but there are examples of running backs succeeding on sub-.500 teams. The average for the sample was .620. Due to the uncertainty involved with forecasting win totals as well as the variations between different sportsbooks, I wouldn’t worry too much as long as a player’s team has a realistic path to seven or eight wins.
That said, following our process, we’ll be giving one knock to any player whose team has a projected winning percentage of under .430, and two knocks to any with a projection under .241. In a 17-game season, that translates to about seven wins and four wins, respectively. (As a peek behind the curtain, yes, I absolutely calculated all this out with raw win total numbers before remembering the new 17-game season would require me to use percentages.)
Metrics That Don’t Matter
I’ll keep this section relatively short, since few likely care about things I’m designating as not mattering. It may shed some light on why I chose not to include certain metrics, however.
There was not strong evidence that BMI was all that important. Our sample of twelve actually had a slightly lower average BMI than the running back position at large. The average league-winning running back had a 42nd-percentile BMI, with a rather wide spread around that mean (the coefficient of variation was 59%). That doesn’t move the needle for me in an era where Christian McCaffrey and his 12th-percentile BMI have posted two of the best fantasy seasons in history via massive target shares. Speed score already covers everything we would want BMI to tell us.
Pass blocking and offensive line grades were also not included to avoid double-counting. Bad pass blocking technique is only an issue in fantasy football insofar as it affects target share, which we’ve already accounted for. Offensive line performance will be partially reflected in win total. Adding them in would overweight these factors. Sorry to all the Twitter users beating their chests about “real football” in my mentions.
While I’ll gladly die on the speed score hill, I’m less comfortable sticking my neck out for the other two-thirds of the PlayerProfiler athleticism metric trifecta. The sample’s agility and burst scores sported lower averages and much wider distributions than their speed score counterpart. The corresponding drills are also performed by players less and less often today, meaning we’d be working with incomplete data that would make comparisons between 2021 candidates difficult. I included these data points initially, but ultimately found the study more illuminating and less noisy with them omitted.
Finally, I know somebody will say I’ve ignored coaching and offensive scheme fits. My answer is that if you can find a “coaching quality” number entirely separate from player quality and usage, I’d be incredibly interested in including it.
The Running Backs That Matter
Before showing you the big spreadsheet, let’s quickly review each of the metrics and why they matter:
- Average Draft Position (fantasy football managers aren’t terrible at projecting players)
- Age as of December 31st, 2021 (peak production is around age 24 for running backs)
- What pick the player was drafted by the NFL (teams also aren’t terrible at projecting players, and they engage in motivated reasoning)
- Speed score (athleticism matters in athletics, being a freak makes it easier to post a freakish season)
- Highest previous seasonal target share (benchmarks receiving ability, durability, and teams’ willingness to use players all three downs)
- Vegas-implied team win percentage (ballparks overall offensive efficiency and projects game script)
I’ve delayed long enough. Here’s how the first 20 running backs by ADP at the beginning of August 2021 compare to the dozen fantasy Goliaths of the last decade.
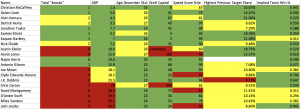
Total knocks = total standard deviations away from means ADP courtesy of FantasyData, circa August 1st Win totals may vary between sources
It may be helpful to know that the average league-winning running back from the last decade had 1.33 “knocks.” Most had zero or one, with Le’Veon Bell in 2014 the only player who sported more than two. One “knock” is not generally a large obstacle to a monster season, especially if the player excels in other areas.
In regards to the metrics for each player, a green background means the stat is within one standard deviation of the league-winner mean, a comfortable range where most league-winners fall. A yellow background means the stat is over one standard deviation away, while red means the stat is more than two standard deviations away from where we want it. Bell, ever the outlier, was the only player of the dozen to have any “red” marks. A red stat mostly eliminates a player from 350+ point (or 372+ in a 17-game season) contention in my mind.
Taking a quick look down the board, Christian McCaffrey, Dalvin Cook, and Alvin Kamara form a clear tier at the top. McCaffrey and Kamara have obviously achieved the 350+ feat before (which is why I’m inclined to give Kamara the benefit of the doubt despite two knocks), and Cook grades out very well to do so this year. If anything, this should only be a gentle reminder that Cook and Kamara are probably a touch older than you thought they were. This trio has the best shot of any you’ll find.
Moving past the top three consensus picks, Ezekiel Elliott, Jonathan Taylor, and Saquon Barkley all have overall RB1 squarely in their range of outcomes. They can be had later in the first round due to their lower perceived floors. In Taylor’s case, injuries to key teammates Carson Wentz and Quenton Nelson could bring down the Colts’ projected win total (and Taylor’s ADP) in the coming days. Even before the injuries, Taylor’s poor target share (arguably the most important metric on here) and the presence of Nyheim Hines had me the least optimistic about him of the three. There is definitely a point in the second round when Taylor’s ceiling does make him a value, so monitor this situation closely.
I’ll catch flak for this, but Derrick Henry and Nick Chubb do not have the ceiling we’re looking for. Not even 378 carries in 2020 were enough to get Henry over the bar we set. Age and previous target share are both obstacles for these players. A Kareem Hunt injury aside, there’s a low chance either break 22 fantasy points per game this year. PPR just isn’t the format for these guys.
If one player on this list will blow up all of this analysis in 2021, it will be Aaron Jones. There’s a lot to like about him in the Packers’ offense with his backfield target competition Jamaal Williams finally gone. Jones has found the end zone at a gargantuan rate the past two years, so if anything will save my credibility, it will have to be goal line work for A.J. Dillon. I shudder at the thought. I still think Jones is fine at his ADP, but after this exercise, I’m no longer holding out hope for a historic season. I hate it too, but draft capital and speed score, both of which Jones falters in, were among the most predictive metrics here.
Back to the positives. If you take only one thing away from this article, it should be that Najee Harris and Antonio Gibson look like fantasy x-factors in 2021. Harris checks every box we need if you include his 13.4% target share from his senior year of college. Saquon Barkley (who had sported a 14.9% senior year target share) is our only example of a rookie breaking the threshold, but at a Round 2 ADP, you can’t tell me you don’t want to find out if Harris can follow in Barkley’s footsteps. Harris is by far the biggest riser in my eyes from this exercise, to where I’ll now be actively seeking him out.
Like Harris, Gibson admittedly requires a bit of projection. That 7.68% rookie year target share may be the only wart on his profile, but it’s a massive one with J.D. McKissic still on the roster. Gibson’s pass protection (there’s your bone, “real football guys”) may need to improve for that number to spike the way it needs to. As a former college wide receiver, we know Gibson is plenty capable in the receiving game, so if I’m projecting an inordinate increase in targets for any running back this year, it will be him.
Conclusion
While this entire undertaking has ultimately boiled down to “target Najee Harris and Antonio Gibson in the second round,” I’d be lying if I said I wasn’t feeling some satisfaction at how much I’ve learned and how many of my assumptions were challenged on the journey to get here. If you stuck around through all this, hopefully you learned something as well.
If you did find this useful, feel free to follow me on Twitter @QBLRyan. I’d be happy to discuss any player through the lens of this study or answer any other questions about it there. Good luck in those drafts!
Photos by David Rosenblum/Icon Sportswire and William Purnell/Icon Sportswire | Adapted by Ethan Kaplan (@DJFreddie10 on Twitter and @EthanMKaplanImages on Instagram)