


About once a year, a running back makes fantasy football history.
Most years, a running back or two deliver stratospheric win rates to their fantasy managers. Jonathan Taylor was the overall RB1 in 2021 on 22 PPR points per game. It is no surprise that he was on 19.5% of winning FFPC rosters, the highest win rate of any running back.
Taylor’s season was actually pretty tame compared to some of the dominant performances of years past. David Johnson in 2016 and Christian McCaffrey in 2019 handily cleared 400 total PPR fantasy points in just 16 games. Some years, it felt like the only way to win was to roster one of these juggernaut running backs.
Last year, Pat Kerrane explained why your goal when drafting running backs early should be to hit on one of these legendary seasons. I hate to cite the same article for a second year in a row, but nobody else has demonstrated this concept as well as Pat has. If you still believe in drafting running backs based on their floors, read his article before continuing this one.
Luckily for us, juggernaut running backs aren’t always drafted in the first few picks. With an average ADP just after ninth overall and examples over the years from throughout the first two rounds, you theoretically have a shot at securing a juggernaut from any draft slot.
The next logical question is how to identify these fantasy superstars. We want to find the running back who will define fantasy football in 2022.
With this goal in mind, I originally analyzed every season of 350 or more PPR points since 2011. The NFL made everything harder for me by moving to the 17 game schedule last year, so the official threshold is now an awkward 372 total points. Taylor was the only running back to qualify in 2021, just sneaking into the club with his 373 points.
As an important disclaimer, this article will not claim to tell you with any certainty which player will be a juggernaut this year. The sample sizes are tiny here, making this exercise more descriptive than predictive. I won’t be wheeling out any p-values today. If you’re the type of sicko who is in to that, check out my recent articles on sophomore wide receivers and how running backs earn targets.
This research is instead best interpreted as applying a set of objective criteria to determine which running backs in 2022 look the most similar to those who have broken fantasy football in the recent past. I believe it provides a decent gauge of a player’s ability to hit a 22+ points per game ceiling, but ceiling outcomes by definition do not occur most of the time.
If you’re returning to this article after reading it last year, feel free to skip ahead to the section labeled “what has changed.” If you’re new or just want a refresher on the juggernaut process, read on.
Let’s dive in.
The Juggernaut Process: Average Draft Position
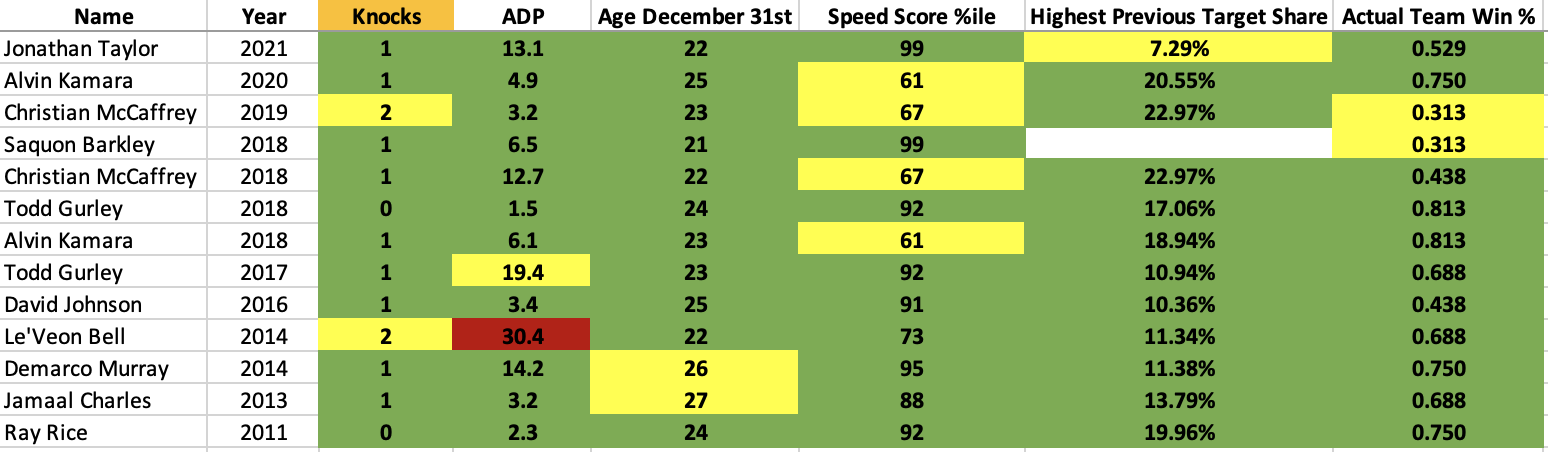
The first and most foundational measure that will define our consideration set is average draft position (ADP). This is because fantasy gamers are surprisingly good at identifying running backs with elite upside. Check out the ADPs from the week leading up to the season of each of the thirteen players who qualified as juggernauts since 2011:
The first thing you’ll notice is that an early pick helps your odds somewhat, but a later one doesn’t spell doom. The average juggernaut running back was drafted just after pick nine, and there are examples on this list selected throughout the first two rounds.
Le’Veon Bell looks like an outlier here, but just to be safe, we’ll consider every player with an ADP in the first three rounds. ADP can shift as the season approaches and new information is made available, so casting a bit wider of a net than normal here makes sense.
That said, we will be penalizing players who fall one or more standard deviations of ADP away from our mean of 9.3. Standard deviation can be thought of as the typical spread in a dataset that is normally distributed around its mean. This allows us to find the ranges that a hypothetical juggernaut running back would likely fall into.
Using a statistical concept called the Empirical Rule, we can determine that most juggernaut running backs will be drafted by pick 17, and nearly all of them by pick 26. Therefore, players being drafted after those marks will receive a “knock,” or a mark against them on our scoresheet.
Why? Think about the heights of most men you see on the street. The majority of men are close to the average of 5 feet, 10 inches. Only a few are taller than 6′ 6”, and similarly few are shorter than five feet. For the same reason it is exceptionally rare to see a man that is seven feet tall, we would expect it to be rare to see a juggernaut running back with an ADP later than pick 26. For a better primer on the concepts of standard deviation and normal distributions, check out this short explainer.
Our methodology will be similar for each metric. One knock on a player doesn’t eliminate them. I’m skipping ahead here, but these thirteen players averaged exactly one knock out of the five metrics we’ll look at.
Back to ADP. “But Ryan! Why does ADP matter? You should be smarter than ADP!” Aside from the old adages about the wisdom of the crowd, ADP can be a good stand-in for projected workload.
You’ll see that a player like Antonio Gibson fits many of the other criteria we’ll discuss, but there’s probably a reason he’s not being drafted until the end of the third or start of the fourth round (or much later depending on the ADP source). Gibson’s playing time in passing and short yardage situations is likely under threat from J.D. McKissic and Brian Robinson, respectively. If both other running backs in Washington were to get injured during the preseason, Gibson’s ADP would likely rise, and we would take his potential to go nuclear this year more seriously. For now, as the analysis will show, it’s rather unlikely.
The Juggernaut Process: Age
Last year, I made the observation that many of the players being drafted in the first round were concerningly old. It is even more true this year. When it comes to age, the trend among juggernaut running backs is clear:
Like it or not, especially in recent years, it has been rare for running backs over the age of 25 at the end of the season to deliver the type of production we’re looking for. Applying our standard deviation calculations like before, we’ll give one knock to any running back who will be 26 or 27 years old on December 31st of this year, and two knocks to any who will be 28 or older.
The running back position is an exceptionally violent one. As players age and injuries pile up, athleticism declines and coaches become less willing to give their players the workloads required for a monumental fantasy season. The decline often comes quickly and without warning, regardless of previous heights. Just take a look at what Todd Gurley has been up to lately. (Hopefully I’m not writing Christian McCaffrey in that spot next year).
The Juggernaut Process: Speed Score
In the past couple years, I’ve gone from believing athleticism was underrated in fantasy analysis to believing it is extremely overrated. Skilled wide receivers in particular are dismissed far too often based on lacking speed, a trait that has tenuous correlations at best to NFL success. At running back, however, size-adjusted speed is still king.
Created by Bill Barnwell and (over)popularized by PlayerProfiler.com, speed score adjusts a player’s 40-yard dash time to their weight, giving extra credit to players who run faster at heavier weights. PlayerProfiler also makes adjustments for times recorded at pro days and neatly catalogues the speed scores of every player into percentiles.
This metric is surprisingly predictive of running back performance since it’s a good approximation of how athletic a player is. Straight-line speed isn’t the only thing that matters at the position, but as we’ll discuss, it’s by far the most useful athleticism metric for identifying top fantasy performers. You’ll probably be more convinced if I just show you.
That’s right; our group of 13 players averaged nearly an 83rd-percentile speed score, pushed up even further from last year by Jonathan Taylor. That means that on average, these players scored better in this metric than 83% of all other players who have run at the NFL Combine or their school’s Pro Day. It turns out that being big and fast creates a high ceiling at running back.
Noticeably, not a single running back in the last decade has qualified for juggernaut status while having lower than a 60th-percentile speed score, and the ones who have been close to that mark really excelled in the other metrics. Unless a player was injured during their run at the Combine, this is a stat to take seriously.
The math works out so that we’ll be giving a player one knock if they’re at or below the 68th percentile, and two knocks if they’re below the 54th.
The Juggernaut Process: Previous Target Shares
In a PPR format, targets and receptions are incredibly important. In fact, the average target was worth as many fantasy points as 2.5 carries in 2021. Unsurprisingly, the thirteen running backs in our sample averaged over 100 targets and an 18.5% target share in the season they exploded. These target shares often spiked much higher than those the player had previously achieved.
So why do we care about target shares players posted before those seasons? For one, past target shares are all we can know when looking ahead at candidates to break the 350-point barrier in 2022. Additionally, since we’ll be using full-season target shares rather than per-game figures, we can also somewhat capture durability and the coaching staff’s trust in a player. If a running back was heavily targeted all season, they both stayed healthy and were consistently put in the game in passing situations.
Why not use career average target shares? Remember, this exercise is concerned with a player’s projectable ceiling. We’d like to give players every possible chance to show us they are capable of commanding high target shares. Ray Rice and Jamaal Charles posted their previous high marks multiple years before their juggernaut campaigns.
Until Jonathan Taylor came along, every single player who reached the pinnacle of fantasy production had previously achieved at least a 10% target share. Even Demarco Murray, who crossed the 350-threshold with just 64 targets in 2014, had handily cleared the 10% threshold.
Target share was Taylor’s only knock in 2021, so it stands to reason that he shifted this study’s parameters most drastically here. It is now much easier to avoid getting knocked for a sub-par target share; Taylor alone brought the first standard deviation down from 11.42% to 10.21%. The second standard deviation (two knock territory) is down to 4.80%.
The Juggernaut Process: Team Win Percentage
This final metric is the toughest of the five to accurately predict before the season begins. However, it can tell us a lot about a player’s situation that we haven’t covered yet, so I felt it was worth including.
To some extent, a team’s win percentage will reflect the overall efficiency of their offense, including the play of the quarterback and offensive line. It will also reflect how favorable of a game script the offense was put in by the defense, leading to more carries for the running back.
You can probably see where I’m going with this. While we don’t have very reliable projections for a team’s 2022 offensive line play or defensive efficiency, we do have access to projected Vegas win totals for the year. These aren’t perfect either, but they’re likely to be a lot more accurate than your favorite analyst’s preseason offensive line rankings.
Here are the actual winning percentages for the teams of each player in our sample:
As you can see, most of these teams did pretty well, but there are examples of running backs succeeding on sub-.500 teams. The average for the sample was .613. Due to the uncertainty involved with forecasting win totals as well as the variations between different sportsbooks, I wouldn’t worry too much as long as a player’s team has a realistic path to seven or eight wins.
That said, following our process, we’ll be giving one knock to any player whose team has a projected winning percentage of under .430, and two knocks to any with a projection under .247. In a 17-game season, that translates to about seven wins and four wins, respectively.
Metrics That Don’t Matter
I’ll keep this section relatively short since few likely care about things I’m designating as not mattering. It will hopefully, however, shed some light on why I chose not to include certain metrics.
There was no strong evidence that BMI was all that important. Our sample of thirteen actually had a slightly lower average BMI than the running back position at large. Going into 2021, the average juggernaut running back had a 42nd-percentile BMI, with a rather wide spread around that mean (the coefficient of variation was 59%). That doesn’t move the needle for me in an era where Christian McCaffrey and his 12th-percentile BMI have posted two of the best fantasy seasons in history via massive target shares. Speed score already covers everything we would want BMI to tell us.
Pass blocking and offensive line grades were also not included to avoid double-counting. Bad pass blocking technique is only an issue in fantasy football insofar as it affects target share, which we’ve already accounted for. Offensive line performance will be partially reflected in win totals. Adding them in would overweight these factors. Sorry to all the Twitter users beating their chests about “real football” in my mentions.
While I’ll gladly die on the speed score hill, I’m less comfortable sticking my neck out for the other two-thirds of the PlayerProfiler athleticism metric trifecta. Compared to speed, the sample’s agility and burst scores sported lower averages and much wider distributions. The corresponding drills are also performed by players less and less often today, meaning we’d be working with incomplete data that would make comparisons between 2022 candidates difficult. I included these data points initially, but ultimately found the study more illuminating and less noisy with them omitted.
Finally, I know somebody will say I’ve ignored coaching and offensive scheme fits. My answer is that if you can find a “coaching quality” number entirely separate from player quality and usage, I’d be incredibly interested in including it.
What Has Changed
All things considered, this process performed well last year. The only 2021 juggernaut was Jonathan Taylor, who last year’s article identified only one knock against. Taylor’s inclusion in the juggernaut sample this year has marginally shifted the thresholds at which players get knocked, most notably in the target share category.
Of course, it is always possible to make improvements. Four-knock Austin Ekeler scored just 0.5 points per game less than Taylor did last year while missing only one game, and two-knock Derrick Henry would have handily qualified if he’d kept up his eight-game pace.
The juggernaut process correctly identified Henry as an injury risk via his age and sub-par target share. Players like Henry that aren’t heavily targeted get drafted in the first round by fantasy managers due to exceptionally high rushing volume, which is predictive of injury. That said, we have seen two-knock juggernauts before. Henry staying healthy would not have invalidated the juggernaut process (though it definitely would have invalidated most of my own fantasy teams).
Ekeler, on the other hand, neared juggernaut status despite knocks for age, speed score, and a double-knock for NFL draft capital. Ekeler’s season realistically could not have gone much better given his massive touchdown total of 20 (would have tied for fourth among juggernaut RBs) on “only” 300 opportunities (would have ranked third-least). Still, this caused me to rethink the value of including NFL draft capital as a metric.
While no players before 2011 were included in the juggernaut sample due to limitations on ADP data, there are examples of players who went undrafted out of college but still achieved juggernaut-level seasons. Arian Foster and Priest Holmes did it this century.
Additionally, the NFL has fundamentally changed the way it values running backs in the draft in the last five years or so. Running backs who would have been first-round locks just a few years ago like Jonathan Taylor and Breece Hall now routinely fall to the early second. Players who could have gone in the second or third round in 2015 now fall to day three.
After re-examining the evidence, I’m no longer convinced that NFL draft capital tells us much of anything that fantasy football ADP doesn’t. Most of the running backs taken early in fantasy drafts were drafted highly by the NFL, and it is probably unfair to penalize players like Austin Ekeler and Aaron Jones who have earned valuable roles in their offenses despite humble beginnings.
That means we are down to five total metrics this year. Let’s take a look at how 2022’s crop of running backs stack up.
Juggernauts Inbound
Before showing you the big spreadsheet, let’s quickly review each of the metrics and why they matter:
- Average Draft Position (fantasy football managers aren’t terrible at projecting players)
- Age as of December 31st, 2022 (peak production is around age 24 for running backs)
- Speed score (athleticism matters in athletics, being a freak makes it easier to post a freakish season)
- Highest previous seasonal target share (benchmarks receiving ability, durability, and teams’ willingness to use players on all three downs)
- Vegas-implied team win percentage (ballparks overall offensive efficiency and projects game script)
Finally, let’s take a look at how the first 19 running backs going off the board in fantasy drafts compare to the juggernauts.
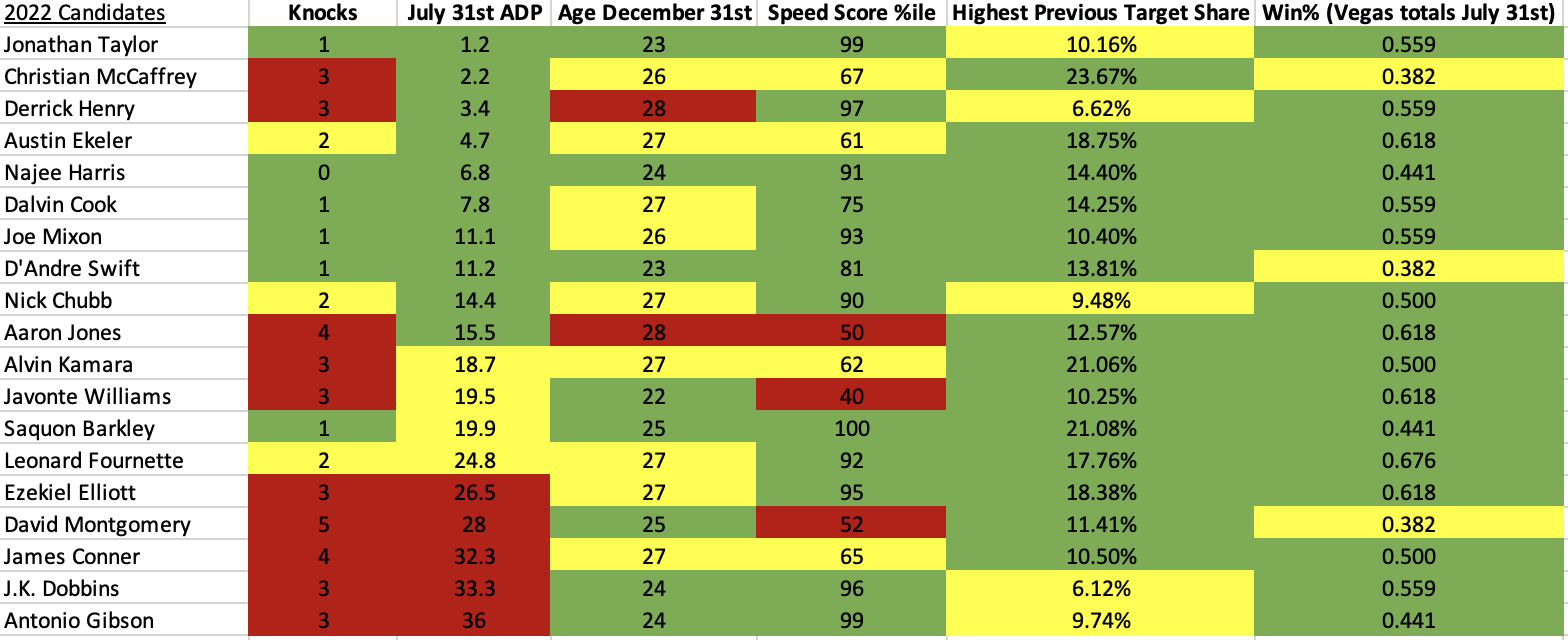 Knocks = number of standard deviations away from means ADP courtesy of FantasyData, circa July 31st Win totals may vary between sources
As a reminder, the average running back that succeeded in hitting at least 22 fantasy points per game over a full season had one knock. Most juggernauts will have zero or one knock, a few will have two, and very few will have three. Here are all thirteen players that qualified since 2011, for reference.
Last year, injecting my own personal biases that were in conflict with the process led to me downplaying the true eventual juggernaut while touting Antonio Gibson. If I’d learned from that mistake, this article would be over. I clearly have not learned.
Jonathan Taylor is set up well for a repeat. Last year’s 93 total red zone opportunities and 86% backfield opportunity share in the red zone will be tough to replicate, but he still has room to grow in the target share department. Large spikes in target share seem uncommon beyond a player’s second year in the league, but former juggernauts Todd Gurley and Jamaal Charles have proven it is possible.
It is time for me to make excuses for Christian McCaffrey, who is now a three-knock player at age 26 on a team projected for only 6.5 wins. There are reasons to not take that big red “3” at face value.
Obviously, McCaffrey himself built the blueprint for posting juggernaut seasons on bad teams via an elite target share. If the Panthers hit the over on their win total, McCaffrey would only be considered a two-knock player at the end of the year, placing him in a group with drastically better probabilities to reach juggernaut status.
Moreover, if McCaffrey does reach a ceiling outcome this season, it is likely to be a higher one than Taylor. Jake Tribbey has what I consider the definitive article covering the McCaffrey vs. Taylor debate. The juggernaut process does not necessarily conflict with his conclusion that Taylor has a greater likelihood of smashing than McCaffrey, but that a McCaffrey smash would make a much bigger impact. Personally, I will still be drafting McCaffrey over Taylor in most leagues with sharp competition, but would not fault anyone for selecting Taylor at 1.01 in a home league against friends or co-workers.
Najee Harris, Dalvin Cook, Joe Mixon, and D’Andre Swift form a clear tier of players who closely resemble juggernauts at the back end of the first round. If I were to subjectively fade one, it would be Mixon, who barely avoids getting knocked for target share this year thanks to Taylor’s impact on the dataset.
The signals out of Cincinnati are mixed at best on Mixon’s chances of handling a three-down role. He was largely phased out of third down snaps at the end of last year, and the combination of Samaje Perine and Chris Evans averaged 1.52 yards per route run (on just 71 fewer routes) to Mixon’s 1.05 last year.
I am here to defend Harris from the naysayers as the only no-knock running back on the list. It’s been popular to project Pittsburgh for an offensive implosion, but Vegas likes them just enough to keep Harris in the green. In the scenario that Pittsburgh’s pass attempts and red zone visits do not fall off a cliff, all Harris needs is a bit of touchdown luck and some improved efficiency running the ball to challenge for juggernaut status.
While the Steelers ranked 2nd in overall pass rate last year, they were just 11th when the game was within one score.
Projecting them to get significantly worse and their pass attempts to significantly fall at the same time is a little strange to me
— Ryan Heath (@RyanJ_Heath) August 10, 2022
Do not pass on Swift or Saquon Barkley in the second round. Healthy seasons out of either are overwhelmingly likely to give their fantasy managers a significant advantage over the rest of the field. Detroit’s and New York’s weaknesses in the win total column could play into the hands of both players from a game script perspective, leading to more passing situations and more fantasy points through the air. No other player in round two can hold a candle to their ceilings. Erik Smith and I talked more about Barkley on a previous QB List Podcast.
Both Alvin Kamara and Javonte Williams need positive news and ADP movement to be taken seriously as juggernaut candidates this year. A suspension of more than a game or two would likely be completely disqualifying for Kamara, and Williams must relegate Melvin Gordon to a 30% snap share in more than just beat writers’ imaginations.
I think it is more likely than not that both Kamara’s and Williams’ ADPs rise as August goes on, and I like both players as values where they’re being drafted now. However, I prefer betting on Swift and Barkley when it comes to overall RB1 upside.
Whether or not you are fully willing to hitch your fantasy fortunes to the juggernaut process, I at least hope this exercise challenged you to take a step back and consider the ceiling outcomes for each player. Personally, Cook and Harris were the biggest risers for me after completing the study. Thank you for reading this far, and good luck in those fantasy drafts!
Images by Icon Sportswire | Adapted by Justin Paradis (@justparadesigns on Twitter)
Excellent article, thanks for your help. Who, if any other RBs, do you see further down the trough that might meet some of the criteria?
Travis Etienne and Breece Hall are the RBs I’ve drafted most in the middle rounds. They’re both young size-speed specimens who commanded good target volume in college. Neither are on good teams, but both have more of a ceiling than the retreads like David Montgomery or Josh Jacobs going around them.
That said, I largely avoid the RB position in rounds 3-6.
Surprised offensive snap % is not somehow figured in. Could be a combo of last year’s snap % and some factor of departed-RB snap % vs incoming-RB prior year snap %
Snap share can be overrated a lot of the time. It matters much more which snaps a player is on the field for. I’ll take a player like D’Andre Swift who doesn’t play as many snaps if he’s in on passing downs and at the goal line.
Vacated snap share might be interesting to look at, but I think that’s going to be heavily factored into ADP anyway. If Gordon were to get injured, Javonte’s ADP would skyrocket.
How many knocks does AJ Dillon have? I understand ADP is a ways away but I would imagine he meets most other criteria and would obviously hit ADP were something to happen to Jones in the preseason
Great article! You’re a top post on r/fantasyfootball :) The only thing I am pondering is the speed score, but only because CMC and Kamara have low scores but have TWICE been juggernauts.
I buy in overall mostly because it seems that Najee has the best and most “obvious” shot of joining the club outside of JT.
Thanks for the work!
Speed Score just equates to the players momentum. Momentum = (mass)x(velocity) and it determines if you’re going to break a tackle or truck someone or if you’re going to get driven back.
Kamara and CMC are much more about shifting and juking than trucking. Because they both caught an insane amount of receptions, they scored a lot of points. They both play slot WR sometimes. As a Saints fan, I remember a few games where Alvin Kamara literally lined up in the X and ran legit routes.
Wow. This is what a quality ffb article consists of; facts, logic, winning-focused contextualizing, and clarity. Bravo and thank you.